Join the Chance Age with Our Latest Tools

by Sam L. Savage

“We shape our tools and thereafter our tools shape us”

— John Culkin

I knew my world had changed in August of 2012 when I discovered that the Data Table function in Excel had become powerful enough to perform practical Monte Carlo simulation without any add-ins. This inspired me to shape an evolving family of tools for creating standalone Excel simulations. These, in turn, have shaped me back in more ways than I can count, in my teaching and consulting practice. Eventually I converged on two buttons that ushered in the Chance Age: SIP Input, and Chance of Whatever.

Our latest tools provide up to three ribbons.

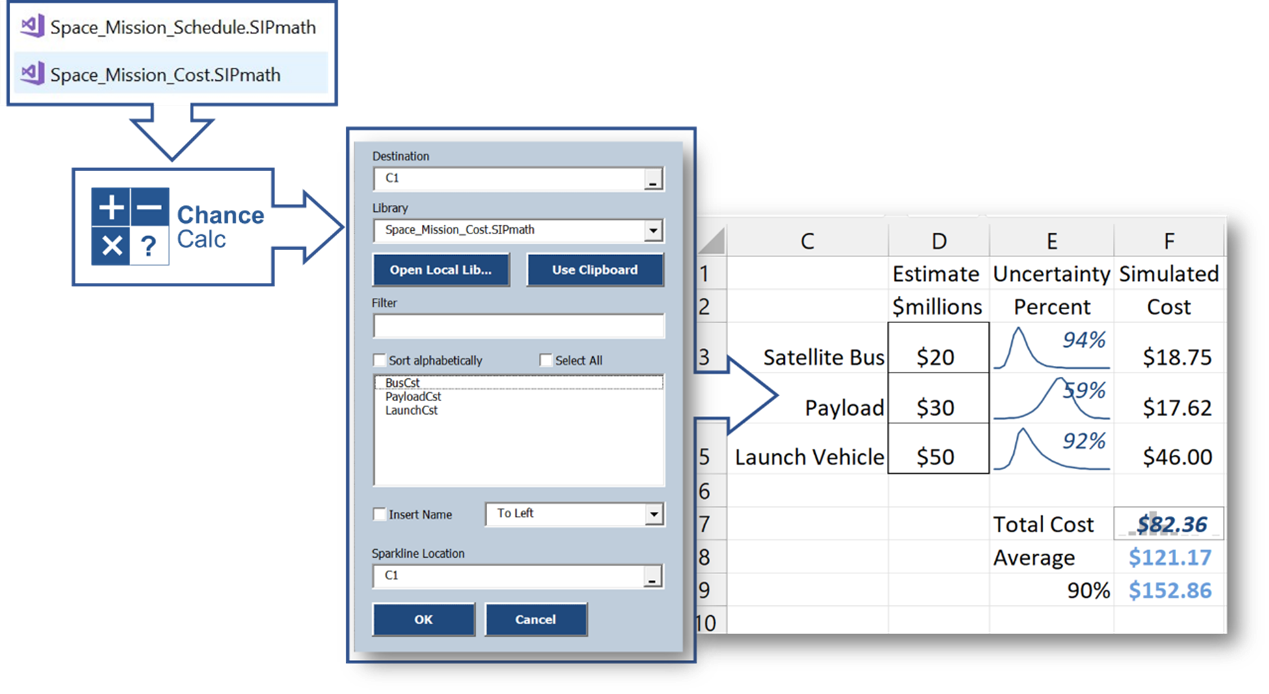
The ChanceCalc ribbon is for making chance-informed decisions based on SIP Libraries created in other programs. Notably, ChanceCalc can read the latest SIPmath™ 3.0 Standard generated by Frontline System’s Analytica Solver. But it can also read SIPmath 2.0 libraries created with ChanceCalc Monte Carlo, Analytica from Lumina Decision Systems, and CSV files generated from @RISK and Crystal Ball.

The new Metalog ribbon copies Tom Keelin’s Metalog Distributions out of his elegant Excel templates and provides several options for pasting or linking them into your model or saving them as SIPmath 3.0 JSON libraries. 

Finally, ChanceCalc Monte Carlo adds a third ribbon that rolls in all the power of our legacy Enterprise SIPmath Tools, with additional important Import and Export features.

And remember, that all the tools in the SIPmath family perform interactive simulation in native Excel through the Data Table so the models created with the tools do not require the tools to run.

The Marketing Funnel Fallacy

by Dr. Sam L. Savage

The Funnel

My colleagues Bridget Cash, Matthew Raphaelson, and I have recently been examining Chance-Informed marketing decisions. It is common to view the transition of a potential customer from first awareness of a product to purchase as a funnel. As a simplified example, consider an email list of 5,000,000 potential customers. Suppose you believe that 10% of these will visit your site. Of those that do, 50% will move on to your Products page, and 40% of those will move on the shopping cart and make the purchase.

But Are You Certain?

Typically, these probabilities are not known with certainty. They may be estimated with Beta distributions or other methods. Let’s assume that the percentages are the correct average of the funnel probabilities, but that they are uncertain with independent errors as shown. Then the funnel fallacy can be stated as follows.

The Fallacy

On Average the Conversion Rate will be the Product of the Probabilities

BUT

The Chance is Over 50% that the Conversion Rate will be Below Average 

Why? When you multiply positive uncertainties together, they skew to the left. The most famous example of this is the normal distribution, which comes from adding independent variables together to make a symmetric distribution and the lognormal distribution which comes from multiplying independent variables together to make a skewed distribution. But skewed to the left implies that more of the distribution is to the left of the average than to the right.

This means that when you are estimating conversion rates based on average funnel probabilities, you will get the correct average, but (and this is the legal term of art) More Likely Than Not you won’t achieve your target. And because this is a universal mathematical fact, you (and here is another legal term of art) Know This or Should Know This.

If you are involved in marketing, hiring, product development, or any other funnel driven enterprise, keep the above in mind the next time you are setting expectations.

I will be discussing the Marketing Funnel Fallacy in my Welcome to the Chance Age webinar series, taking place on September 28 and 29. I hope to see you there.

© Copyright 2022, Sam L. Savage

Chancification in Cost Estimation

by Sam L. Savage

In my blog post Making Your S Curves Actionable,” I described my introduction to ICEAA, the International Cost Estimating & Analysis Association. Christina Snyder, Vice President of the ICEAA, and Patrick Malone of Systems Planning and Analysis Inc., an ICEAA member, have assisted me in developing cost estimation examples for future versions of my Welcome to the Chance Age webinar series. We have recently added webinars on September 28 and 29.

ICEAA members already make probabilistic cost estimates based on standalone simulations using such packages as @RISK and Crystal Ball, so they are already halfway to Chancification. What would it take to get them all the way, and so what if they did?

What Would It Take?

Very little. As a reminder, Chancification conveys arrays of simulation trials (SIPs or Stochastic Information Packets) between applications much as electrification conveys electricity between power plants and end users. The simplest way to do this is with the cockroach of all data formats, the CSV file, which can be easily generated from virtually any simulation system. But just as in electrification there is both direct and alternating current of various voltages, in Chancification there are more structured formats, including the open SIPmath™ 3.0 Standard that can generate up to 100 million random variates of almost any distribution along with metadata in a very small JSON file.

So What?

Here are several benefits of Chancification:

  1. Large simulations may be aggregated from small simulations. Imagine a simulation of operating expense for a single aircraft, which takes the cost of fuel into account. To simulate a fleet of 100 such aircraft, today one might just add 99 planes to the simulation you already had. But sooner or later such models collapse under their own weight. Chancification provides an alternative. Each of the 100 aircraft can be simulated separately in various computational platforms. The only requirement is that they use the same SIP of fuel price (and any other global inputs). That way the output SIP of each plane is coherent with the other SIPs in the fleet, as they use precisely the same fuel price on each trial. This in turn means they may be added together to create the SIP of fleetwide cost.

  2. Once the SIP Libraries are generated by the data scientists and statisticians, they may be used in chance-informed decisions by non-statisticians in any environment, including native Excel.

  3. If the 18th century economist Adam Smith was correct, we may see specialization within the industry, with some firms focused on selling high fidelity stochastic libraries of the costs of components, while others focus on assembling these libraries into models of large systems. This will only be possible with standard data formats for moving SIPs from producers to consumers.

I hope you can join us at my Welcome to the Chance Age webinar series to learn more about Chancification in cost estimation and many other areas.

100 Million Monte Carlo Trials in 88 Bytes!

ProbabilityManagement.org Announces the Metalog Interface

by Sam L. Savage

Wait a Minute!

Claude Shannon’s information theory says you can’t store 100 million numbers in 88 bytes.

True, but Tom Keelin’s Metalog distribution, driven by Doug Hubbard’s HDR pseudo-random number generator, can create identical streams of up to 100 million random variates on any platform. Now ChanceCalc 1.3, currently in beta, includes an interface to Tom Keelin’s elegant Excel Metalog templates. Using these templates, you can create 3.0 JSON libraries or paste Metalog simulation formulas directly into Excel for use with ChanceCalc, the SIPmath Modeler Tools, @RISK, or Crystal Ball

How Does This Work?

Like Taylor series, Metalogs can take any number of terms (see Wikipedia). But for practical purposes, 18 parameters will model virtually any continuous distribution you will face. In its standard configuration, the HDR generator takes up to four initialization seeds, which provides great flexibility when sharing SIPMath™ 3.0 Libraries with others. The version of the HDR built into our tools, which has been limited in numerical accuracy to support Excel, can generate 100 million random numbers before the rubber band breaks (or rather, before the results on the dieharder test deteriorate). So that’s a total of 22 input parameters (88 bytes) to generate nearly any distribution. The open SIPmath 3.0 Standard wraps these 22 parameters in JSON objects containing metadata that can be used in Excel, Python, R, or virtually any other computer platform.

The first commercial package to read and write the SIPmath 3.0 Standard was Frontline Systems’ Analytic Solver. This powerful Excel add-in performs both simulation and optimization, including stochastic optimization. Our new interface lets you use Tom’s templates directly.

Want to Learn More?

We are looking for beta testers for this new software. All those interested in becoming beta testers will need to attend a free information session where I will demonstrate the software.

Watch Sam Savage and Alex Sidorenko discuss the new Metalog interface

© Copyright 2022, Sam L. Savage

The SIPply Chain Forum

by Sam L. Savage

The man who knows HOW will always have a job.
The man who also knows WHY will always be his boss.

— Ralph Waldo Emerson

I have now delivered my first few Welcome to the Chance Age webinars, and they have inspired a new initiative, the SIPply Chain Forum. I will lead a series of monthly web gatherings in which I and my fellow combatants in the War on Averages will share their experiences in developing SIP libraries. This will start out as an invitation-only event, open to attendees of the webinar series, who are invited at no expense to join me for the latest developments and present their own work. Attendees from the first sessions are grappling with uncertainties ranging from public housing revenues to the sales of building supplies to the impact of cyber-attack.

As a reminder, SIPs are standardized data structures for conveying uncertainty, developed and promulgated by ProbabilityManagement.org. Once uncertainties such as those described above are translated into SIPs using the SIPmath™ Standard format, any Excel user with the ChanceCalc add-in can easily use them to illuminate the chances of meeting specified goals. But where do SIPs come from? Ideally from statistical experts and data scientists, for use by decision makers without such skills. This is analogous to electrical engineers producing the power to illuminate the lightbulbs of non-engineers.  

But if probability were electricity, it would be 1895, the date of Westinghouse’s first hydro powerplant at Niagara Falls, so we should all consider ourselves pioneers. The reason WHY we fight averages is because they result in dumb outcomes known collectively as the Flaw of Averages. However, many of you don’t know HOW to create SIP Libraries. But this is what Statisticians and data scientists do know HOW to do, so according to Emerson, they will eventually be working for us.

In the meantime, in the SIPply Chain Forum, we will collaboratively build small prototype libraries and study a growing body of examples, ranging from the Covid Hospitalization Library generator developed by Eng-wee Yeo of Kaiser Permanente to the portfolios of petroleum exploration projects at Shell that kicked off the discipline of probability management. 

At this point ChanceCalc can read three different file formats, which may be produced by a wide range of software packages. I have summarized these in the table below. I look forward to seeing you at one of our SIPply Chain Forums where we will all be learning how to move into the Chance Age together.

Making Your S Curves Actionable

Illustration of the "Ugly Duckling" by Milo Winter, a renowned illustrator (August 7, 1888 – August 15, 1956), first published in 1916 in the United States in the book "Hans Andersen's Fairy Tales."

Finding My Flock

by Sam L. Savage

I typically don’t pick up a lot of friends by discussing probability in polite company, leaving me feeling like the ugly duckling in the fairy tale. But earlier this month I attended a meeting of the International Cost Estimating & Analysis Association (ICEAA), at which I felt like I finally found my flock of swans.

This nonprofit organization is devoted to improving cost estimation in the face of uncertainty as required by the Department of Defense Estimating Guide. By definition, they are all applied statisticians. The talks I attended were practical but rigorous, on subjects as diverse as reducing the expense of space launch vehicles, assessing the costs of climate change, and pooling resources to create a new generation of small nuclear reactors. Unlike some meetings I have attended, the audience did not bolt for the door as soon as the session ended but stuck around to ask questions. It was very refreshing.

Everyone in this group is familiar with probability distributions. They generally view these as S Curves, since it is easy to read probabilities directly off them. But when they need to perform calculations with distributions, they typically revert to Monte Carlo simulation. Most were unaware that with probability management, you can sum uncertainties directly as data (or perform any other calculation for that matter).

My keynote presentation was entitled Making S Curves Actionable, and it described a proof of concept I developed with Christina Snyder, an experienced cost analyst and Vice President of the ICEAA. Suppose you had an S Curve for the development of a new missile system, and another S Curve for the per unit manufacturing cost of the missiles. Then to find the total program cost for 150 of the missiles, the current approach would be to run a Monte Carlo simulation based on the two S Curves. Christina and I created a 3.0 SIPmath library in JSON that allowed us to calculate Program Cost as S Curve1 +150 x S Curve2 using ChanceCalc.

I am excited by the potential synergy between the two nonprofits and hope to continue working with Christina and others at ICEAA to combine our open standards and technologies with their best practices in costs estimating. Stay tuned for more soon.

In the meantime, we have added more dates in July and August for my highly interactive Welcome to the Chance Age webinar series. As a reminder, attendees receive a free copy of ChanceCalc, a free Kindle copy of Chancification: How to Fix the Flaw of Averages (valid only for U.S.-based email addresses), and $200 off the Enterprise SIPmath Tools.


Introducing the First Online Generator in the Probability Power Grid

by Sam L. Savage

Here is an exciting new online application to generate ChanceCalc-compatible SIPmath 3.0 JSON libraries. As input, it can take either a CSV file of Monte Carlo trials, or a list of Quantile value estimates of an expert.

This app will be made available to attendees of my “Welcome to the Chance Age” webinars, where I will explain its use.  

CSV Mode

In this mode, the app takes in CSV files generated from any Monte Carlo package such as @RISK or Crystal Ball. The user has the option to have the app calculate correlation coefficients between variables, or model them as independent.

Quantile Mode

This mode is perfect for capturing expert opinion. In this mode, if correlation is desired, the user must enter the coefficients.

Welcome to the Chance Age!

There are lots of ways to get involved:

Give Chance a Chance

Join Us For a Two-Part Webinar Series on Chancification

by Sam L. Savage

The Light Bulb

About 25 years ago a light bulb went on. It was the bulb in my office at Stanford when I flipped on the switch. That may not sound so remarkable, but it suddenly dawned on me that I had no idea how to generate the electricity required to power the thing. This was at a time when I was obsessing over the fact that spreadsheet users were plugging averages of uncertain quantities into their spreadsheets and blindly reporting the outputs, in flagrant disregard of Jensen’s Inequality. It was before I had coined the term “Flaw of Averages”, but I had already come up with the poster child for this problem: the drunk whose average position is the center line of a highway.

The solution was Monte Carlo simulation, and two powerful packages existed for doing this in spreadsheets, @RISK and Crystal Ball. Why wasn’t everyone using them? There were three reasons.

  1. There was extra software to buy. That price was miniscule given the financial magnitude of the problems the software could solve.

  2. There was extra software to learn. That was a bigger hurdle than the price.

  3. You had to practically be a statistician to know what sort of distribution to plug into these packages. I viewed that as the biggest barrier to the widespread use of Monte Carlo.

But when the light bulb went on that day, I suddenly saw the solution to the third hurdle. If I could use electricity generated by someone miles away that I didn’t even know, why couldn’t people use random variates in their simulations that had been generated by others? Instead of power distribution, it would be distribution distribution! I figured it would only take a few months to work out the details and get it to work. Boy, was I wrong …

...Twenty-five years pass …

Now available in paperback

The Probability Power Grid

The probability power grid is here, and it enables what I call Chancification (the title of my just published book, now available in paperback). Chancification enables enterprise-wide calculations based on probabilities instead of numbers, much as electrification enabled systems based on electricity instead of fossil fuels.

And speaking of just published, the newest version of ChanceCalc, the light bulb of Chancification, is now available from ProbabilityManagement.org.

Webinars

If probability were electricity, it would be 1895, when Westinghouse built his first big power plant at Niagara Falls. With all this cool technology suddenly available, the nonprofit is focusing on its educational mission in the area of Chancification, with webinars and other content from thought leaders and industry experts.

To kick off this initiative, I will be offering a two-part webinar series called Welcome to the Chance Age, which includes a full copy of ChanceCalc, a discount on the Enterprise SIPmath Tools, and a Kindle copy of my new book.

Welcome to the Chance Age Webinars

  • Give Chance a Chance describes how to fix the Flaw of Averages with ChanceCalc linked to SIP Libraries of uncertainties.

  • The Probability Power Grid shows how to create SIP Libraries from the SIPmath Tools, @RISK, Crystal Ball, or directly from the Web.

Chance-Informed Readiness Summit

Come be a fly on the wall
at a summit on
Chance-Informed Readiness in Defense, Pandemic Modeling, and Infrastructure


Wednesday March 30, 8:30 AM - 4:30 PM PDT

Join the livestream as a select group of thought leaders gather in person to discuss chance-informed readiness across multiple disciplines. For a fee of $200, attendees will have the opportunity to participate in multiple Q&A sessions with speakers and will receive a copy of Dr. Savage’s new book, Chancification: How to Fix the Flaw of Averages, currently available on Kindle and soon to be released in paperback.

Last year saw pivotal developments in the SIPmath™ 3.0 Standard as well as the beta testing of ChanceCalc. As we have not had a physical meeting since 2019 due to the pandemic, we decided to dip our toes back into the waters of live events by hosting a small summit with multiple Q&A sessions for an online audience as shown in the schedule below. For more details and speaker bios, visit the registration page.

Schedule (all times PDT)

Session 1: SIPmath Standard

8:30 AM - 9:00 AM: Chancification - Sam Savage
9:00 AM - 9:30 AM: Introduction to Metalog Distributions - Tom Keelin
9:30 AM - 10:00 AM: SIPmath Support in Analytic Solver - Dan Fylstra
10:00 AM - 10:15 AM: Q&A for Online Audience

Session 2: Defense

10:15 AM - 10:45 AM: From Ready or Not to How Ready for What - Connor McLemore
10:45 AM - 11:15 AM: Probability Management at Lockheed Martin - Phil Fahringer
11:15 AM - 11:45 AM: Chance-Informed Aircraft Fleet Management - Steve Roemerman
11:45 AM - 12:00 PM: Q&A for Online Audience

12:00 PM - 1:00 PM: Lunch Break

Session 3: Expert Opinion / Healthcare

1:00 PM - 1:30 PM: The FrankenSME: Synthesizing Expert Opinion - Doug Hubbard
1:30 PM - 2:00 PM: Making CDC Forecasts Actionable - Eng-Wee Ethan Yeo
2:00 PM - 2:30 PM: Building Chance-Informed Capability in Healthcare - Justin Schell
2:30 PM - 2:45 PM: Q&A for Online Audience

Session 4: Infrastructure

2:45 PM -3:15 PM: Explaining Cyber Insurance to Municipalities - Shayne Kavanagh
3:15 PM - 3:45 PM: Stochastic Libraries in Infrastructure Planning and Risk Management- Sam Savage
3:45 PM - 4:15 PM: "Risk-Spend Efficiency"? How Utilities Can Use It - Max Henrion
4:15 PM - 4:30 PM: Q&A for Online Audience

Chancification: How to Fix the Flaw of Averages

Now available on Amazon Kindle


by Sam L. Savage

I am happy to announce the release of my latest book, Chancification: How to Fix the Flaw of Averages, available on Kindle and soon to be released in paperback.

In my previous book, The Flaw of Averages, I introduced the concept of probability management, which represents uncertainties as auditable data called SIPs. Since then, technical contributions from a wide range of talented individuals backed up by a dedicated team here at ProbabilityManagement.org have turned this concept into a practical discipline. Today experts can generate SIP Libraries on virtually any software platform (think electricity), for use by non-experts in chance-informed dashboards on virtually any other software platform (think light bulbs). Welcome to the Chance Age!

The book, with a foreword by Doug Hubbard and illustrations by Jeff Danziger, describes how new technologies and data standards allow organizations to replace calculations based on numbers with those based on chances, just as electrification replaced systems that run on fossil fuels with those that run on electricity. Topics include:

  • Curing Post-Traumatic Statistics Disorder (PTSD) with Limbic Analytics, which connects the seat of the intellect to the seat of the pants.

  • Downloadable examples of how to fix the Flaw of Averages in Excel.

  • The Arithmetic of Uncertainty: Arithmetic tells you that X+Y=Z. The Arithmetic of Uncertainty ask what you want Z to be, then estimates the chances.

  • Speaking Uncertainty to Power: Clear explanations of chances can earn you the permission to be uncertain.

  • The Technology of Chancification, including the SIPmath™ 3.0 Standard from ProbabilityManagement.org, based on Doug Hubbard’s portable random number generator and Tom Keelin’s breakthrough Metalog distribution.

Get 30% off the paperback version of The Flaw of Averages

Chancification shows how to solve the problems of dealing with uncertainty exposed by my earlier book, The Flaw of Averages: Why We Underestimate Risk in the Face of Uncertainty (John Wiley & Sons, 2009, 2012). If you have not read either one, I would start with current book. However, it refers to the first book throughout for deeper explanations of the math of uncertainty.

John Wiley & Sons has generously offered a 30% discount on the paperback edition of The Flaw of Averages. Use discount code BPFS2 (be sure to click Apply) at the link to the left.

© Copyright Sam Savage, 2022