Natural Hazards
Members: AON, The Pew Charitable Trusts, Pyrologix - a subsidiary of Vibrant Planet
Establishing protocols for conveying hazards
Explicitly communicating chances not averages
Empowering decision and policy makers without statistical training
Hazard risks are often expressed as averages. For example, Town A and Town B, below, each have 100 houses, and each have the same average risk of one house fire per year. If you want to help us cure this form of the Flaw of Averages, read on. If you are OK equating Town A with Town B, this page is not for you.
“The single biggest problem in communication is the illusion that it has taken place” - George Bernard Shaw
Today powerful computers can simulate the risks imposed by natural hazards such as floods, earthquakes and wildfires. Unfortunately, the results of such simulations are often conveyed as averages, which mask the hazard’s geospatial aspects as with Town A and Town B.
The CHANCES Consortium has applied an efficient first-generation protocol for conveying geospatial hazards for the city of Berkeley.
Origins of Chances Consortium
Don't Blame the Scientist
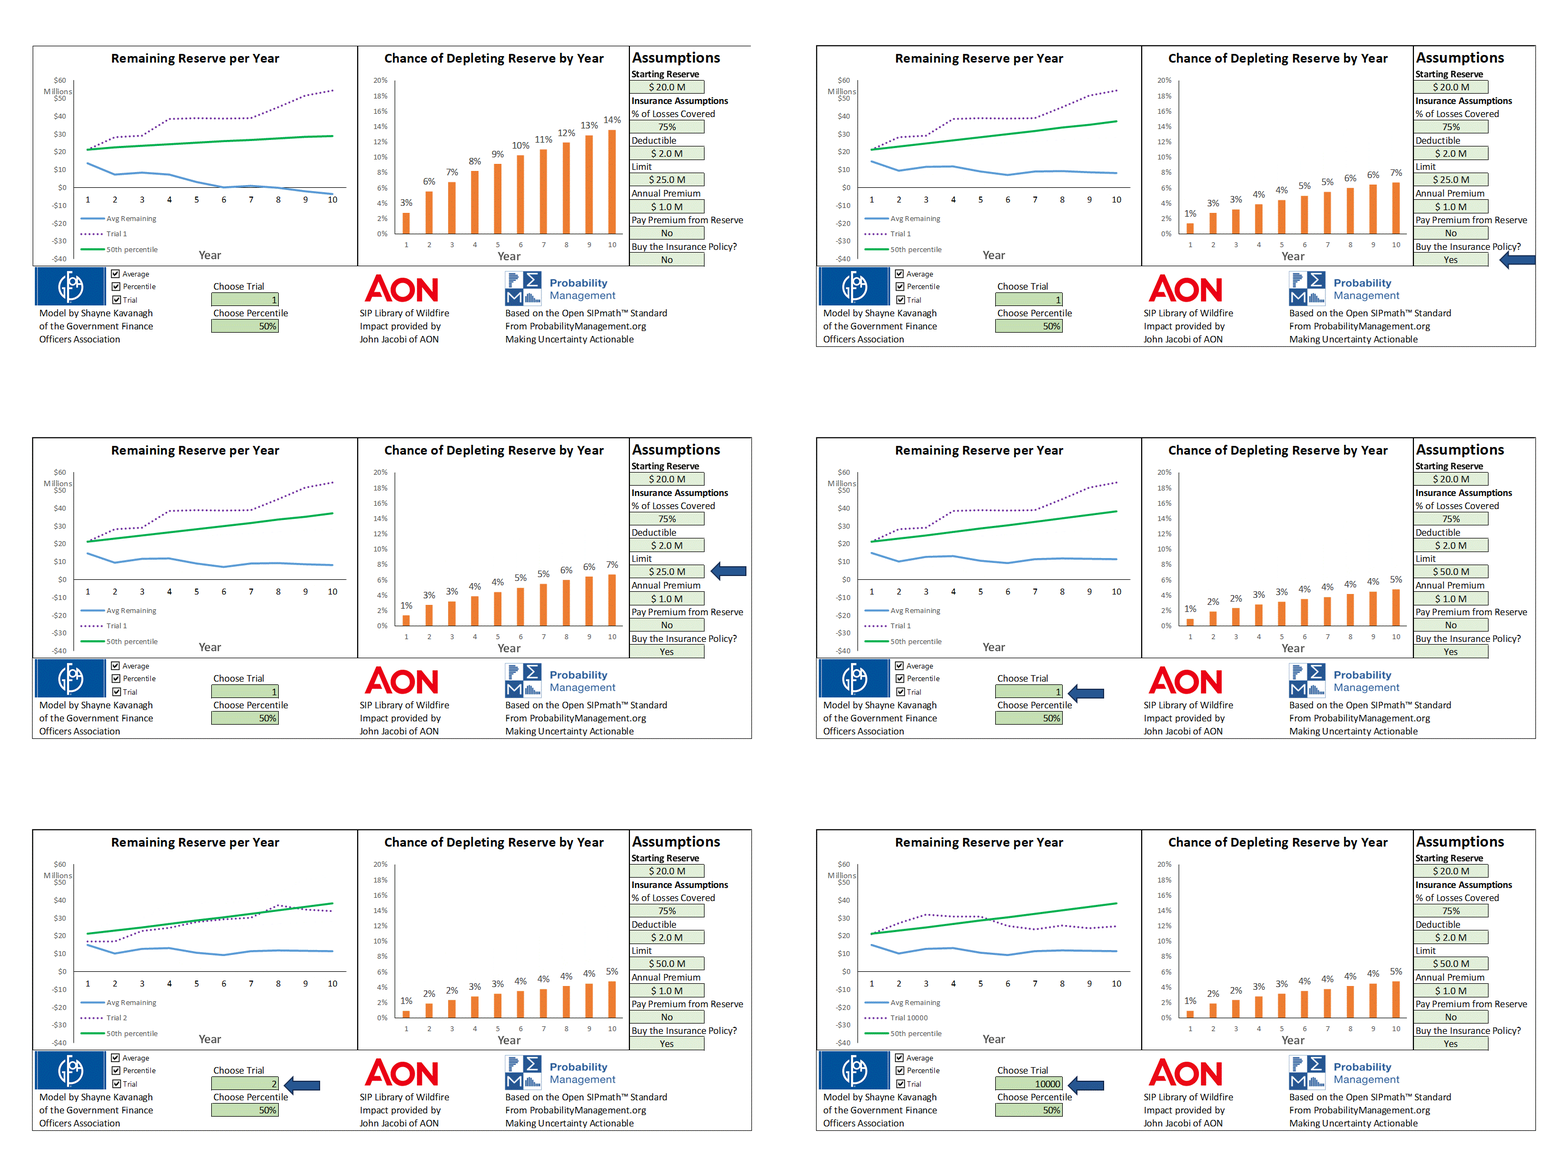
Fire Impact Reserve Estimator
by Shayne Kavanagh
The model, developed by Shayne Kavanagh of the Government Finance Officers Association estimates the chance of depleting a municipality's reserve over a ten year period. When you make a change to a green assumption cell, 10,000 trials are run for each of ten years for a total of 100,000 calculations using the Excel Data Table.
The data, provided by John Jacobi of AON came from a complex simulation built and compiled on large, distributed computer networks on which event generation can take many days to run.
The Open SIPmath™ Standard from 501(c)(3) nonprofit Probability Management.org conveys uncertainty as arrays of auditable data called SIPs, which obey the laws of arithmetic and the laws of probability. It is compatible with virtually any computer platform.
Curing the Flaw of Averages in Climate Change
by Dr. Sam L. Savage
This article investigates how simulation can help predict and prepare for flooding and other damage caused by climate change. PSD Citywide, September 2019.
SIPmath Flood Model
This model demonstrates that the average damage from flooding is greater than the damage associated with the average crest.


