What is the Metalog Distribution?

What Do You Want It to Be?

by Sam L. Savage

The Shmoo is a fictional character created in 1948 by cartoonist Al Capp for his Li’l Abner cartoon strip.

According to Shmoo - Wikipedia,

Shmoos are delicious to eat, and are eager to be eaten. If a human looks at one hungrily, it will happily immolate itself—either by jumping into a frying pan, after which they taste like chicken, or into a broiling pan, after which they taste like steak. When roasted they taste like pork, and when baked they taste like catfish. Raw, they taste like oysters on the half-shell.

They also produce eggs (neatly packaged), milk (bottled, grade-A), and butter—no churning required. Their pelts make perfect bootleather or house timbers, depending on how thick one slices them.

Shmoos (plural is also Shmoon according to Wikipedia) are common in mathematics. For example, Taylor series and Fourier series are ways of mimicking not chicken or steak, but whole slews of mathematical functions through weighted sums of simpler functions. In the case of Taylor series, the simpler functions are F(x) = 1, F(x) = x, F(x) = x2, etc. These are called the basis functions of the series. As an example, the Taylor series of ex is 1 + x + x2 / 2 + x3 / (3*2) + … xn / (n!) … The more terms you include, the more it tastes like chicken, I mean ex. Fourier series use Sines and Cosines for their basis functions and are central to signal processing.

These famous mathematical Shmoos were developed hundreds of years ago. A brand new Shmoo is the Metalog, invented by Tom Keelin to mimic probability distributions. Its basis functions are related to the Logistic distribution, hence the name Metalog(isitic).

It has been five years since Tom first explained his elegant family of probability distributions to me, and today Metalogs play diverse and vital roles within the discipline of probability management, which is concerned with conveying uncertainty as data that obey both the laws of arithmetic and the laws of probability. I expect Metalogs to revolutionize the much larger field of statistics as well, but that will be more like turning an aircraft carrier compared to the patrol boat of probability management. Being small and maneuverable has given our organization the rare opportunity to help pioneer a real breakthrough.

The value of a revolutionary idea is not obvious, or it wouldn’t be revolutionary. My first reaction to Metalogs was, that’s very nice, but now I have one more distribution to remember along with the Erlang, Gaussian, Gompertz, Weibull, and all the other “Dead Statistician” distributions. The whole point of probability management is that the user doesn’t need to remember all this junk, and now I have something else to cram into my closet.

In retrospect I have rarely been so wrong. It took a while to figure out that I could actually put the Metalogs in the closet and then take the rest of the contents out to the curb for bulk trash pickup. But I’m getting ahead of myself. This is the first in a series of blogs on revelations about Metalogs, a subject which is growing fast. Some of my readers will want to know all about Metalogs and all of my readers will want to know something about Metalogs. But in the future, I believe that many of my 7.6 billion non-readers will know nothing about Metalogs, yet will be impacted by them nonetheless.

Tom has just created a concise 7-minute Flash Intro to Metalogs video that I highly recommend. If you don’t have seven minutes, it plays beautifully at 1.5 x, resulting in 4.66 minutes that might just change the way you think about statistics. Then stay tuned for my subsequent blogs that cover other important aspects of Metalogs.

ChanceCalc™ Beta 1.1 Now Available

by Sam L. Savage

ChanceCalc1.1.png

The SIPmath™ Standard communicates uncertainty unambiguously and coherently from data scientists and statisticians to decision makers. The standard created the groundwork for Chancification, which takes computer simulation from siloed applications to collaborative networks in which managers need nothing more than a simple application like ChanceCalc to make chance-informed decisions. Applications include: 

  • Linking national weather simulations to power grid simulations to estimate the chance of collapse due to failed equipment, excess heating, or air conditioning load.

  • Aggregating risks across infrastructure networks to mitigate the chance of safety risks at minimal cost.

  • Using crowdsourced data on forecasting errors to estimate the chance of achieving projected tax revenues.

  • Linking the results of  ensembles of COVID-19 models at the CDC to local models to predict the chance of exceeding ICU capacity 

The models created with ChanceCalc are standalone Excel files that perform hundreds of simulation trials per second and do not require the add-in to run.

We have made the following changes to ChanceCalc since the first beta version in May 2021:

  • Numerous bug fixes.

  • We have frozen the SIPmath 3.0 Standard, which stores uncertainties as JSON objects. Now ChanceCalc can read libraries created in Python, R, or Analytic Solver from Frontline Systems (see below).

  • Frontline’s Analytic Solver has become the first commercial software package to support the new standard. It can easily create SIPmath 3.0 Libraries for export and can import them to do powerful stochastic optimization.

Here are some ways you can learn more about ChanceCalc, which is available now in beta test:

  1. Watch our videos on ChanceCalc and Frontline’s Analytic Solver below.

  2. Download the latest version here.

  3. Look through the Getting Started guide for a quick overview of what ChanceCalc can do.

  4. Explore the Tutorial to get hands-on tips for using ChanceCalc to cure the Flaw of Averages.

© Copyright Sam Savage, 2021

The SIPmath™ 3.0 Standard and Analytic Solver V2021.5

The AC Current Standard and First Industrial Power Plant of Chancification

by Sam Savage


ProbabilityManagement.org is proud to announce the first general release of the SIPmath 3.0 Standard for storing virtual SIPs in the universal JSON format. And we are delighted that the latest Analytic Solver from Frontline Systems both reads and writes this format.  

The discipline of probability management represents uncertainties as data that obey both the laws of arithmetic and the laws of probability. SIPmath 2.0 accomplished this by storing arrays of thousands of Monte Carlo trials. SIPmath 3.0 accomplishes this with a tiny fraction of the storage. If probability were electricity, then SIPmath 2.0 would be direct current and SIPmath 3.0 would the alternating current that we all use today.

HDR.png

The SIPmath 3.0 Standard uses Doug Hubbard’s HDR random number generator to maintain statistical coherence, generating identical streams of pseudo random numbers across platforms, including native Excel.

Metalogs.png

These random numbers feed Tom Keelin’s Metalog Distributions, a flexible system for creating an extremely wide range of continuous random variates, including multi-modal.

The Analytic Solver encompasses optimization, machine learning, simulation, and powerful techniques. Its “Deploy Model” allows you to

“create, test and refine probability distributions that should be used across your company -- say for exchange rates or commodity prices -- using Analytic Solver's 60+ classical, Metalog, and custom distribution creation tools -- then deploy and share them as probability models, following the open Probability Management SIPmath 3.0 standard.”

Hydropower.png

Using SIPmath 3.0 ensures that you will get the same Monte Carlo trials in ChanceCalc, Python, R, or, if you have the patience, on an abacus. And going the other way, you may generate probability distributions in a wide variety of simulations, which may be imported into Analytic Solver to use with its powerful stochastic optimization engines.  

I expect this package to play as central a role in Chancification as the 1895 Tesla/Westinghouse hydro power station at Niagara Falls played in electrification.


© Copyright 2021 Sam L. Savage


Increasing our Personal Liberty while Fighting COVID-19

by Sam L. Savage

Danziger_Car.png

"In this country, saving freedom is more important than trying to regulate lives through legislation," screamed the headline, and as a libertarian who resents a big blundering government pushing me around, I was sympathetic. The year was 1987, when states were mandating seatbelt usage, but similar tradeoffs between individual freedom and personal safety exist today. In a recent article in The Atlantic, Vaccinated America Has Had Enough, conservative columnist David Frum writes that for some people, “vaccine refusal is a statement of identity and a test of loyalty.” For these people, the increase in their civil liberty by not getting vaccinated is adequate reward to compensate for the risk imposed by the virus. In finance such a reward is known as a risk premium. But is this the best policy, even for the most freedom-loving of the vaccine hesitant?

By taking a chance-informed approach, we can explore alternatives that offer both more civil liberty and less risk than simply not getting the vaccine. First, the numbers. The data show that the vaccines are ten times more effective at preventing fatalities (99.5%) than gunshot wounds to the head are at causing them (95%).  For purposes of argument, we will use the current daily death toll from COVID-19, of about 600 (although it is currently climbing), nearly all of whom are among the 30% of the population who are totally unvaccinated. So here is a thought experiment, NOT AN ACTUAL SUGGESTION, to stimulate discussion around alternative and potentially better tradeoffs between personal liberty and the risks presented by COVID-19:

The unvaccinated could both make a stronger identity statement and simultaneously reduce everyone’s risk if they got the shot, but then rewarded themselves with the freedom of not wearing their seatbelts!

The Risks

On the risk side, there is risk to others and risk to self. The risk to others is negligible when you don’t buckle up. But not getting vaccinated puts everyone at risk except the virus, which loves new hosts in which to mutate its way out from under the current vaccines. I estimate that the combined deaths per day among the unvaccinated from either COVID-19 or car crash is currently 600 to COVID-19 and 30 on the highway [1] for a total of 630. If those people all got vaccinated but removed their seatbelts, the numbers would change to about 3 deaths due to COVID-19 [2] and 55 to crashes [3] for a total of 58 per day. This is a reduction in risk of about 90% by simply interchanging one expression of personal freedom for another.

The Reward

With the seatbelts you get the increased personal freedom of not having to strap yourself down every single time you get in a car, but in addition, you have a choice of how forceful an identity statement you want to make. No one can tell that you haven’t been vaccinated just by looking at you, but with the seatbelts there are a range of options. If you want to keep your new liberated status to yourself and avoid being pulled over by the police, just save a piece of seatbelt after you cut it out of your car and hang it over your shoulder when you drive. On the other hand, if you really want to thumb your nose at authority, you can close the belt in the door and let it drag down the street, leaving a trail of sparks.

[1] There are roughly 100 highway deaths per day in the US, so 30% of the population would account for about 30 deaths.

[2] 0.5% of 600, or 3, would be expected to die even with the vaccination.

[3] Seatbelts are only about 45% effective at saving lives in a crash, so the 30 per day would go up to about 55 per day.


Copyright © Sam L. Savage 2021. All Rights Reserved.

Models vs. Modules

by Sam Savage

sandcastle.png

Models vs. Modules

The discipline of probability management is defined by representing uncertainties as data, called SIPs, that obey both the laws of arithmetic and the laws of probability. One of the biggest implications of using SIPs is that formerly monolithic simulation models may now be decomposed into modules that are networked together through SIP Libraries, with the outputs of some models used as inputs to others. This is easy to explain. The hard part is getting people to understand it. So, here is a metaphor. Large simulation models are often like sandcastles, which eventually collapse under their own weight, or erode due to the tides of change. Modules are like Lego blocks, which can be assembled into structures. If you don’t like some part of a construction, or it becomes obsolete, you can snap off the old blocks and snap on new ones.

Examples

ProbabilityManagementPart1ORMS.png

Royal Dutch Shell

Probability management arose out of work at Royal Dutch Shell starting in 2005 by Daniel Zweidler, then a manager at Shell, Stefan Scholtes, a Professor of Management Science at Cambridge, and me. It was driven by the fact that although Shell’s exploration engineers could simulate the daylights out of the Net Present Value of any particular venture, they couldn’t simulate their whole portfolio because the model was too big and would collapse under its own weight. See the foundational article in OR/MS Today.

image-asset.gif

The Lego blocks for the Shell portfolio were SIPs for each of the ventures, that is, arrays of thousands of Monte Carlo trials describing the range of possible NPVs for that particular venture. Hours were spent generating the library of SIPs for all ventures. But once that was done, because SIPs obey the laws of arithmetic, the SIP of NPV of any portfolio could be found nearly instantly by adding together the SIPs of its constituent ventures. This was done in an interactive Excel dashboard, which allowed managers, only a couple of levels below the CEO, to click things in and out of prospective portfolios. With every keyclick they would instantly see the consequences of their portfolio decisions in terms of both risk and return in a number of dimensions.  That took place back in the Bad Old Days before Excel’s Data Table became powerful enough to bring interactive SIPmath simulation to all, so the portfolio model was contorted into a single row with hundreds of formulas, which were then copied down 1,000 times to refer to individual rows of the SIP Library. In subsequent years, we relied on Frontline System’s interactive simulation and stochastic optimization to continue the project with a more practical implementation. A training model used to teach Shell executives at Cambridge University is available for download. IMPORTANT: You need to enable macros to access the clickable scatter plot. Depending on the version of Excel, before opening, you may need to right click on it, go to Properties, then click Unblock.

A Pharmaceutical R&D Portfolio

A few years later, but still before I was aware of the breakthrough with the Excel Data Table, I worked on a similar problem with a large pharmaceutical firm. Although their analysts could simulate the daylights out of the Net Present Value of any particular R&D drug, they couldn’t simulate their whole portfolio because the model was too big and would collapse under its own weight. Furthermore, they needed to simulate it under numerous discount rates and other external factors like success probabilities for the drugs, market assumptions, etc. Again, it took hours on two separate computers to create the SIPs of the individual projects. There were roughly 50 drugs of each of two classes, and roughly 60 experiments with combinations of the external variables. And did I mention that it took 5,000 Monte Carlo trials to get it to converge? I’ll save you the math: 2*50*60*5000 gives you 30 million numbers, or 6,000 SIPs of 5,000 trials. But because SIPs obey the laws of arithmetic, we added all the SIPs of each type of drug together to get the SIP of NPV for the portfolio of all Type 1 drugs and the portfolio of all Type 2 drugs. That left us with 60 pairs of SIPs, one for each drug type and each experiment.  The final dashboard with disguised data shows spinner controls that allowed us to scroll through the assumptions, which instantly pointed to the portion of the SIP Library resulting from that experiment.

Pharma.png

At one point the assistant CFO wondered what the risk/return profile would look like if the lab were twice as big and could diversify over twice as many drugs. At first we figured it would take weeks to run a model with two hundred drugs to find out. But it took only minutes. One of the outputs was a SIP of 5,000 trials of the NPV of the entire portfolio. We simply copied that SIP, permuted it to model the NPV of a second similar but independent R&D lab, then added the two SIPs together. It was like snapping together Lego block models of two labs to get a model of a lab that was twice as big. And remember, SIPs also obey the laws of probability, so the resulting SIP told us all we needed to know about the risk and return of the imaginary larger and more diversified company.

Fast Forward to the Age of Chancification

Both the Shell and Pharma SIP libraries were used within single organizations in single dashboards for making critical decisions. But today, such libraries could be posted in the cloud and used collaboratively by hundreds of users with ChanceCalc (which runs simulations in native Excel using the Data Table).

As an example, the CDC can model the daylights out of future COVID-19 hospitalizations. Now imagine adding the models of all the hospitals in the country to the CDC model to better manage the pandemic, creating an enormous model that would collapse under its own weight. In a future blog I will describe how we have created SIP Libraries of predicted hospitalizations for each state, which may be stored in the cloud. In theory, these models could be snapped  like Lego blocks into hospital management models nationwide to model surges in the current pandemic, or even cases of the good old-fashioned flu.

If you would like to learn more about ChanceCalc and Chancification:

  1. Sign up to beta test ChanceCalc and provide feedback on the performance and tutorial.

  2. If you are familiar with Monte Carlo simulation, download the SIPmath Modeler Tools.

  3. Sign up for our Chancification webinars.


© Copyright 2021 Sam Savage

Chance-Informed Decisions

by Sam L. Savage

Jacob Bernoulli, 1655 – 1705

Jacob Bernoulli, 1655 – 1705

A Good Bad Example

Victor Hugo said: “I am not completely useless. I can serve as a bad example.” The same can be said of Operation Eagle Claw, the failed attempt to rescue the American hostages in Iran in 1980. It is highlighted in military operations research training as an egregious example of the Flaw of Averages, and yet military readiness planning is still subject to similar faulty thinking. Eagle Claw is such a good bad example that it has played a central role in our efforts at ProbabilityManagement.org to promote a chance-informed approach to military readiness planning, as described in our latest publication for the Center for International Maritime Security. Our basic approach is to model the readiness of military units with SIP Libraries that allow readiness to be defined in terms of the chance that a unit, or combination of units, can accomplish a specified mission at some non-specified time in the future with little time to prepare.

You’d think we would all be getting tired of Eagle Claw by now, but some errors in reasoning are truly immortal, and I have now written two short docudramas on the subject below. But first, a short recap of the story.

The Story yet Again

The planners of the mission knew they needed six helicopters to rescue all the hostages, and given the hostile relationship with Iran, they had to either rescue them all or abandon the mission. The Sea Stallion aircraft involved were known to be 75% dependable. That is, on average (as in the Flaw of Averages), 25% of the helicopters would suffer mechanical difficulties, leaving 75% airworthy. The planners could do arithmetic and sent eight aircraft because 75% of eight is six. Imagine if the planners had been able to do the arithmetic of uncertainty, or had been aware of the binomial distribution worked out by Jacob Bernoulli 300 years earlier. Then they would have known that sending eight helicopters implied essentially one chance in three of having insufficient aircraft for one of the most important military missions in recent history. They also would have been able to calculate that this probability of failure would be cut roughly in half by sending nine helicopters, and in roughly half again by sending ten. Eagle Claw is remembered for a tragic refueling accident in the desert with the loss of eight servicemen, but that occurred after the mission had been scrubbed because three of the helicopters had mechanical problems, leaving them with only five.

ChanceCalc and the Arithmetic of Uncertainty

Arithmetic tells us that X+Y=Z. The Arithmetic of Uncertainty says: “What do you want Z to be? Here are your chances.” ChanceCalc, the revolutionary Excel add-in from ProbabilityManagement.org, estimates the chances of achieving your goals without ever having heard of Bernoulli or the binomial distribution. This tool was designed for non-statisticians using the open, cross-platform stochastic libraries that our team has been proposing as a framework for estimating military readiness. But the same approach applies to risk management, financial modeling, and decision analysis in general. Although ChanceCalc is doing full on stochastic modeling, we have found that most people are less intimidated by the term “Chance-Informed decision making.”

To drive home the importance of this concept, I have written two very short docudramas called “Eagle Claw” and “Chance-Informed Eagle Claw,” which demonstrate the difference.

EAGLE CLAW 

COMMANDER: How many helicopters do I have to send if I need six to complete the mission? 

ANALYST: Eight, on average.

CHANCE-INFORMED EAGLE CLAW 

COMMANDER: How many helicopters do I have to send if I need six to complete the mission? 

ANALYST: Eight, on average.  

COMMANDER: What's the chance I won't have all six when I need them?

ANALYST: 32%. Why do you ask?

If you want to avoid acting out the “Eagle Claw” docudrama and bring chance-informed decision making to your organization, here are some things you can do:

Chancification

ChanceofWhatever_Button_.png

A New Era in Probability Management

by Sam L. Savage

The discipline of probability management represents uncertainties as data called SIPs that obey both the laws of arithmetic and the laws of probability. Three complementary breakthroughs in simulation technology are bringing the field to a new level in a process we call Chancification.

Just as electrification replaced systems running on fossil fuels with those running on electricity, Chancification replaces calculations running on numbers with those running on probabilities. And just as electrification required both a power grid for distribution and lightbulbs to make electricity useful, Chancification provides a probability power grid for representing uncertainty and a new lightbulb in ChanceCalc to illuminate decision in the face of uncertainty.

ChanceCalc, which makes use of Virtual SIPs stored on the SIPmath Network, is so revolutionary that I hope you will watch the video below to learn more about it.


The probability power grid itself is based on three complementary breakthroughs in simulation technology.

The AC Power Standard

The 3.0 PM SIPmath Standard, led by Sam Savage, represents uncertainties as virtual SIP arrays based on the HDR Generator and Metalog distributions.

The 3.0 PM SIPmath Standard, led by Sam Savage, represents uncertainties as virtual SIP arrays based on the HDR Generator and Metalog distributions.

The AC Power Generator

The HDR Random Number Generator, developed by Doug Hubbard, ensures statistical coherence across simulations running on different platforms.

The HDR Random Number Generator, developed by Doug Hubbard, ensures statistical coherence across simulations running on different platforms.

The Transformer

The revolutionary Metalog Distributions, invented by Tom Keelin, are unprecedented in quantifying uncertainty from data with a single family of formulas.

The revolutionary Metalog Distributions, invented by Tom Keelin, are unprecedented in quantifying uncertainty from data with a single family of formulas.

But technology alone is not enough. We urge you to explore Chancification in more detail and assist your organization in curing the Flaw of Averages. 

Here’s what you can do:

  1. Read the article on Chancification in ORMS Today.

  2. Sign up to beta test ChanceCalc and provide feedback on the performance and tutorial.

  3. Sign up for our Chancification webinar series.

© Copyright 2021 Sam Savage

The PRECISE Uncertainty Project

Projected Revenue Estimation from Crowdsourced Information on Statistical Errors

Precise_Uncertainty.png

By Sam Savage (bio in sidebar) and Shayne Kavanagh (bio)

It is difficult for municipal financial officers to accurately estimate their tax revenues, especially during uncertain times such as the recession of 2008 to 2010 and the current COVID-19 pandemic. Customarily forecasts are based on a single number, with no indication of its chances of being met.

We are helping some CFOs of municipalities estimate the chances of meeting projections and are eager to help others as well. Read on to see how you can apply this approach within your own organization.

The goal of nonprofit ProbabilityManagement.org is to deliver statistical measures of uncertainties to non-experts as actionable data, much as power stations deliver energy to consumers as electricity. We have come to call this process chancification, because for the first time, it provides organizations with a standard approach for illuminating the chances of achieving their goals. In the example below, ProbabilityManagement.org teamed up with the Government Finance Officers Association (GFOA), a professional organization of over 21,000 financial managers, to bring chancification to municipal budgeting.

The ABCs of Chancification

The steps of Chancification are:

  • A. Assess the situation

  • B. Bound the uncertainty

  • C. Correlate the variables

  • D. Deliver stochastic libraries

  • E. Employ the results to improve decision making.

A: Assess the Situation
In 2015, GFOA did a study of the accuracy of tax revenue projections from around 30 municipalities. This resulted in a database containing forecast vs. actual revenues, crowdsourced across multiple tax categories, cities, and time periods.  

B: Bound the Uncertainties
The data provided estimates of the bounds on the uncertainties in forecast accuracy. We quantified these with SPT Metalog distributions.

 
Precise Uncertainty-1.png
 

C: Correlate Variables
We used R to correlate the errors between tax categories.

 
Precise Uncertainty-2.png
 

D: Deliver Stochastic Libraries
We created libraries of forecast errors for two economic time periods, one good and one during  the recession.

Precise Uncertainty-3.png

E: Employ Results
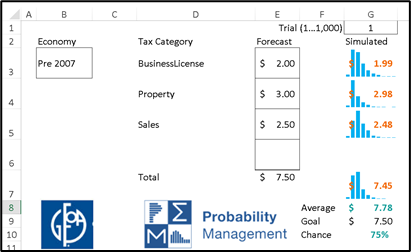
We created an Excel dashboard, linked to the library, that lets the user choose tax revenue types from a menu, specify the forecast for each, and then estimate the chances of achieving each tranche of a prioritized budget.

Precise Uncertainty-4.png

Thus, was born 

Projected Revenue Estimation from Crowdsourced Information on Statistical Errors 

or the PRECISE Uncertainty Project. It is indeed precise in the sense that the uncertainties are represented as auditable data; stochastic information packets (SIPs) that obey both the laws of arithmetic and the laws of probability.

Reference class forecasting, developed by Daniel Kahneman, Nobel Laureate in Economcs, is a method of predicting future outcomes based on similar experiences in the past. The PRECISE Uncertainty Project takes this approach further by creating reference class objects: individual interrelated forecasting errors of each revenue types, which may be combined using conventional arithmetic to predict the accuracy of the entire budget.

Last fall, we presented an early version of this work at Risk Awareness Week, a conference organized by Alex Sidorenko, Chief Risk Officer at EuroChem. In fact, it was Alex, a veritable impresario of risk, who first characterized this approach as “crowdsourced.”


We are now seeking volunteers to both experiment with this system and provide more historical accuracy data to expand the study. To learn more about how your organization can start down this path:

For full videos of all five probability management presentations at Risk Awareness Week, visit our Presentations page.

© Copyright 2021 Sam Savage and Shayne Kavanagh

The Axiomatic Fallacy Fallacy

A Commentary on Radical Uncertainty: Decision-Making Beyond the Numbers by John Kay & Mervyn King

by Dr. Sam L. Savage

Which one does not belong?

Airplane_RadicalUncertainty1.jpg
Airplane_RadicalUncertainty2.jpg.png
Airplane_RadicalUncertainty3.png

Answer: The one in the middle, because it does not fly

The Ludic Fallacy

In The Black Swan [i], author Nassim Nicholas Taleb describes seemingly implausible occurrences that are easy to explain after the fact. The classic is the black swan, assumed to be impossible by Europeans until one was discovered by explorers in Australia in 1697. In the book, Taleb defines the Ludic Fallacy as “the misuse of games to model real-life situations.” That is, “basing studies of chance on the narrow world of games and dice." Ludic is from the Latin, Ludus, a game or sport. And I agree that it is naïve to model complex phenomena like economies, weather, and cyber-attacks on such simple uncertainties, but … 

The Ludic Fallacy Fallacy

I define the Ludic Fallacy Fallacy as “attempting to model real-life situations without understanding the narrow world of games and dice." These teach us truths about actual economies, weather, and cyber-attacks just as paper airplanes teach us truths about aerodynamic forces. 

Radical Uncertainty

Radical Uncertainty: Decision-Making Beyond the Numbers by John Kay & Mervyn King [ii] is the Ludic Fallacy on steroids. It is a 500-page critique, not of “the narrow world of games and dice,” but of the narrow axiomatic approach to decision making under uncertainty, which has been widely adopted in economics, finance, and decision science. In keeping with Taleb, I will call this the Axiomatic Fallacy. Since my father, Leonard Jimmie Savage, was one of the founders of the approach, and proposed the pertinent axioms in his 1954 book, The Foundations of Statistics, I was eager to see what Kay and King had to say.

The Axiomatic Approach

My father framed the issue as follows:

The point of view under discussion may be symbolized by the proverb, “Look before you leap,” and the one to which it is opposed by the proverb, “You can cross that bridge when you come to it.”

Looking before leaping requires advanced planning in the face of uncertainty, for which my father sought a formal approach under idealized circumstances. Interestingly, Radical Uncertainty and my own book, The Flaw of Averages, both quote one of the same passages from my father’s work, in which he describes the application to practical problems:

It is even utterly beyond our power to plan a picnic or to play a game of chess according to this principle.

By this, my father meant that the axiomatic approach applied to making optimal choices only in what he called “small worlds,” in which you could enumerate all the bridges you might encounter along with the chances of encountering them. According to Kay and King, both my father and his Nobel Prize winning student, Harry Markowitz, who applied the theory to investments and invented Modern Portfolio Theory, were careful not to claim “large world” results. But the authors complain that for years, many economists and others have pushed the theory beyond its intended limits.

The book makes extensive use of the “small world” vs. “large world” motif. The authors blame the failures of macroeconomic models on “large world” radical uncertainties such as recessions, wars, technological breakthroughs, and things we have not dreamt of yet. These are the sorts of models that did NOT predict the personal computer revolution, recession of 2008, Brexit, Trump, etc. I myself would go further and argue that even in a perfectly deterministic world, many of the large models used in macroeconomics would collapse chaotically under their own weight due to their inherent non-linearity.

I agree that it is naïve to believe you can model “large worlds” in the same way that you can model “small worlds.” But that does not mean that small worlds are irrelevant. As the late energy economist Alan Manne said, “To get a big model to work, you must start with a little model that works, not a big model that doesn’t work.” Thus, to create an airliner, you are better off starting with a paper airplane than an attractive likeness made of plastic blocks.

My role model for bridging the “small world” of theory and the radical uncertainty of the “large world” is William J. Perry, former US Secretary of Defense. Here is a man with a Bachelors, Masters and PhD in Mathematics, who has nonetheless had a remarkably practical career devoted to preventing nuclear war. I once attended an after-dinner speech of his at which someone asked if he had ever built a mathematical model to solve a thorny problem while at the Pentagon. “No,” he responded, “There was never enough time or data to do that. But because of my training I think about things differently.” Amen. Some may see Radical Uncertainty as a refutation of probabilistic modeling. But I see it as an affirmation of Bill Perry’s approach of understanding probability and knowing when and when not to build a model.

The problem is that a book about unsuccessful mathematical modeling is a little like a book about bicycle crashes. If you don’t know how to ride a bicycle, you certainly won’t want to learn after reading about broken skulls, and you will not have learned about the joy and benefits of bicycles. If, on the other hand, you do ride, then you are already aware of the risks and rewards and are not likely to alter your behavior. In either case I believe the authors could have accomplished their goal in fewer than 500 pages.

I share many of the authors’ misgivings about large models, and in fact, similar concerns motivated the creation of the discipline of probability management as I will discuss below. But first I want to address the non-modelers, who may wrongly take the book as a call to just talk about problems through “Narratives,” as suggested by the authors, instead of analyzing them.

An example I use to make this distinction is basic arithmetic (small world) vs. accounting (large world). Just because you know that 1+1 equals 2 does not mean you can be an accountant. On the other hand, you could not be an accountant if you didn’t know that 1+1 equaled 2. But the accountant must also be aware of the radical uncertainties of fraud, money laundering, etc. that appear in the real world of accounting.

I was shocked years ago to discover how many statisticians and economists (and a much larger fraction of graduate students in analytical fields) do not know the equivalent of 1+1=2 in the arithmetic of uncertainty [iii]. That is, when asked to build the simplest of models in the smallest of worlds involving game-board spinners, they come off like accountants who can’t add 1+1. So radical uncertainty can’t take all the glory for bad models, with chaos theory running neck and neck, and ludic stupidity nipping at its heels.

I agree that Kay and King expose a number of valid shortcomings of complex stochastic models. But their main remedy appears to be the power of “Narrative.” As a storyteller I am all for narrative, but I will define the use of narratives that are not informed by probabilistic principles as the Axiomatic Fallacy Fallacy. Below are some concrete suggestions for some of the issues they raise.

What is Going On Here?

A repeated theme of the book is the inability of models based on past data to determine “What is going on here?” Several concepts are embedded in this theme, and the black swan is an example that comes to mind. No amount of data on white swans could ever be extrapolated to create a black one. But there is more to it than that. As a parable, in learning how to fly sailplanes, like most novice pilots, I focused on the “small world” measurements provided by the instruments. However, I was unable to control the plane until my instructor made me focus on the “big world” by looking out the windshield. Only then did I learn to fly by the seat of my pants and assess what was going on. Given the choice of either instruments or a windshield in an airplane, I would take the windshield hands down. But I prefer both, and coordinating them requires connecting the seat of the intellect to the seat of the pants.

Years later, when PCs became so fast that they could perform interactive simulation with thousands of calculations per keystroke, I discovered that “interactive” simulation could similarly provide a gut feel and view out the windshield for the underlying relationships being modeled. I refer to this approach as Limbic Analytics, because the limbic system is the structure that connects the reptilian brain (the seat of the pants) with the rest of the stuff between our ears (the seat of the intellect). John Sterman [iv] of MIT has also had great success in teaching managers how to make better decision in the face of uncertainty with interactive simulation.

The real issue is expecting models to tell you What is Going on Here in the first place. Successful modeling is not a destination, but a journey, in which an evolving family of models eventually “tell you something you didn’t tell them to tell you,” as consultant, Jerry Brashear, puts it. And at that point, if you are lucky, the modeling effort results in the right question, which may lead to What is Going on Here.

Decomposing large problems into smaller problems for which solutions are known or can be calculated

Kay and King contrast unsuccessful models in macroeconomics to the successful engineering models of aircraft and satellite trajectories. They describe how such models are solved through decomposition into smaller models. This is the issue that motivated the discipline of probability management. Deterministic models may be easily decomposed because the numeric results of sub models may simply be aggregated using arithmetical operations. This is not true of models of uncertainty. It is common practice to perform arithmetic on the “averages” of the uncertainties, which famously leads to the Flaw of Averages. In probability management, uncertainties are represented as data, which obeys both the laws of arithmetic and the laws of probability [v]. The data elements, called SIPs (Stochastic Information Packets), are essentially arrays of Monte Carlo realizations, which may be operated on with vector arithmetic to add or multiply uncertainties together. For example, we could subtract the SIP of costs from the SIP of revenue to get the SIP of profit. The result is another array upon which probabilistic operators may be applied, such as the average profit is $1 million, or chance that profit will be less than $800,000 is 30%.

The authors emphasize the need for a pluralism of models

Kay, King, and I completely agree on the impossibility of anyone building a macro model of the economy. Then again, no single person could build the real economy either. This explains the disaster of centrally planned economies and the success of decentralized ones. The authors call for a pluralism of models, which I refer to as decentralized modeling. Again, this is easy with deterministic models, but was nearly impossible with stochastic models before the open SIPmath Standard allowed SIP libraries generated by one model to be shared with many other models. Consider multiple business units of an integrated health care provider operating in the environment of an uncertain pandemic. One should be able to access SIP libraries of uncertain infection growth from any number of competing contagion models. These could then in theory drive the economic models of the business units, producing a second level of SIP libraries. Finally, these secondary libraries could feed a portfolio model that displayed the risks and returns of various combinations of business units.

RadicalUncertainty4.png
 

This allows multiple decentralized “small world” stochastic models developed independently to be aggregated into larger stochastic models. Today the only way to aggregate stochastic models is through large monolithic applications, which, like sandcastles, eventually collapse under their own weight. The decentralized approach is more like Lego blocks, in which individual blocks may be replaced as the world evolves. Will this approach take us all the way to “large world” models? I doubt it, but I have found that the narratives it drives are more compelling than the narratives not based on models.

All Models are Wrong

The statistician George Box said that “All models are wrong, but some are useful.” Dwight Eisenhower, supreme Allied Commander in WWII, said that “Plans are nothing; planning is everything.” I say that models are nothing; modeling is everything, because it will help you be more like William J. Perry and figure out what is going on here. 

On a final note, after my father introduced the two proverbs quoted above, he went on to write: 

When two proverbs conflict in this way, it is proverbially true that there is some truth in both of them, but rarely, if ever, can their common truth be captured by a single pat proverb.

In spite of my father’s warning, I will try, nonetheless. 

The more options you have in place for crossing bridges before you come to them, the less looking you need to do before you leap.

References

[i] Taleb, Nassim (2007). The Black Swan. New York: Random House. p. 309. ISBN 1-4000-63

[ii] Kay, John & Mervyn King. Radical Uncertainty: Decision-Making Beyond the Numbers (p. 399). W. W. Norton & Company. Kindle Edition.

[iii] Savage, Sam L. Statistical Analysis for the Masses in Statistics and Public Policy, Bruce D. Spencer (Ed.), Clarendon Press, Feb 13, 1997

[iv] http://jsterman.scripts.mit.edu/Management_Flight_Simulators_(MFS).html

[v] https://www.probabilitymanagement.org/s/Probability_Management_Part1s.pdf

© Copyright 2020, Sam L. Savage

Flying Into the Eye of the Pandemic

Beware of the Pilot Induced Oscillation (PIO)

by Sam L. Savage

Recently I have been struck by the similarities between managing the pandemic and flying a plane. In both situations you are responding to lagging indicators. Learning about this phenomenon through flying taught me to connect the seat of my intellect to the seat of my pants, which today I call limbic analytics.

In the late 1970s I learned how to fly gliders over the soybean fields just west of Chicago, and it was one of the few things in life that was as good as I thought it was going to be. But it was not easy.

Having built and flown model planes as a kid, and having studied physics in college, I expected flying to come naturally to me. It didn’t. The seat of my intellect and the seat of my pants were often at odds with each other, and they had to reestablish mutual trust a few thousand feet above the world in which they had teamed up to teach me to crawl, walk, run, swim, and ride a bike.

This mind/body link is described in detail in my book The Flaw of Averages in Chapter 5: The Most Important Instrument in the Cockpit. And because of the pandemic and the lagged indicator problem, it has recently been front of mind for me.

You can’t learn how to ride a bicycle by reading about it, and the same is true for flying. My friend Ron Roth and I created a flight simulator where you can experience this lesson in limbic analytics for yourself. In any plane, if you fly too slowly, you will stall and lose control, and if you fly too fast, you will rip the wings off. Not surprisingly, these unfortunate possibilities weigh heavily on the mind of the student pilot, who tends to focus their gaze on the airspeed indicator. They shouldn’t.

In a glider, or normal airplane at constant power setting, the speed depends on the pitch up or down of the nose. Imagine that you are creating an on-demand roller coaster in the sky just in front of you. Pull back on the stick and the nose points up, slowing you down. Push forward and the nose points down and the speed picks up. The problem is that because the speed lags the pitch of the nose, the novice pilot with their eye on the airspeed indicator tends to make a growing set of overcorrections, which can lead to loss of control (see video).

This is known as pilot induced oscillation or PIO, and the solution is to NOT look at the airspeed indicator, but to focus on the angle of the nose above the horizon, which is a leading indicator of airspeed. That’s why the most important instrument in the cockpit is the windshield!

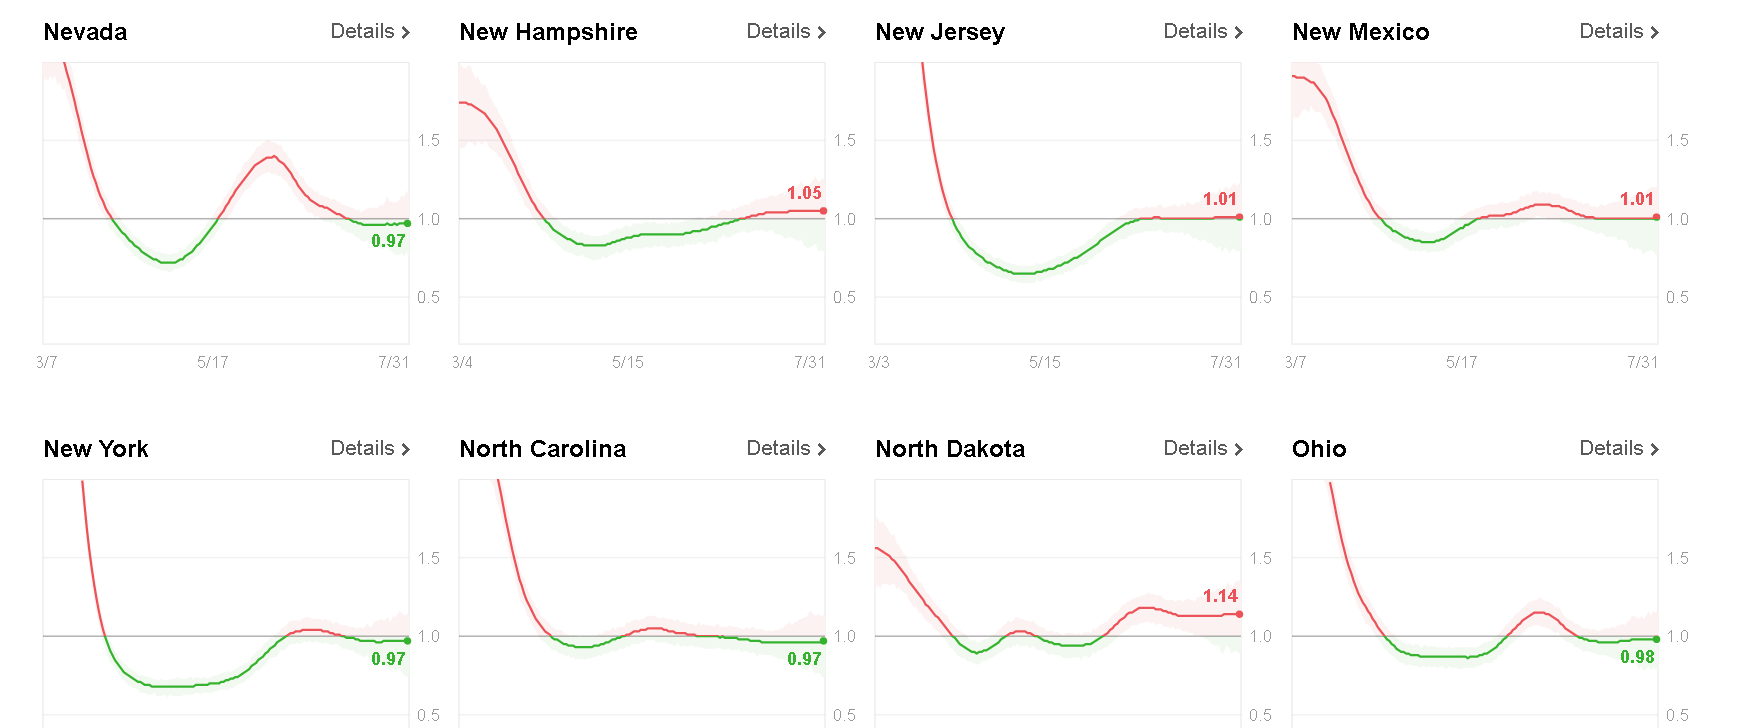
But, where were we? Oh yes, the pandemic. The death rate is lagged from the ICU patients, which is lagged from those admitted to the hospital, which is lagged from those infected, which is lagged from the infection rate, which we can’t really see. So, this is not an easy plane to fly. If you don’t believe that it is difficult to maintain control through lagging indicators, try flying our simulator in various modes and compare the graphs of your attempts to control the speed to the graphs of the infection rates from rt.live, a website that plots current infection rates by state. You will find an uncanny resemblance.

Graphs from rt.live

Graphs from rt.live

And how about flying the economy? It’s even harder! Mathematically, contagion growth is a piece of cake compared to an economy. Oh, and how about influencing human behavior in the face of unknown threats? That’s harder even than the economy, and all three of these unstable airplanes need to be flown in tight formation.

The pandemic equivalent of the angle off the horizon is the infection rate. The economic equivalent involves manufacturing, inventory levels, housing permits, etc. Public behavior is traditionally influenced by the news media and politicians who are often at odds.  

So, what can our nonprofit do to help?

Even without political strife, the communication of uncertainty between epidemiologists, economists, reporters, and politicians is usually reduced to average outcomes, as in the Flaw of Averages. Our nonprofit has now brought the war on averages to the pandemic by helping the stakeholders unambiguously communicate the uncertainties faced in their own domains. See our previous blog posts:

If you want to learn more about our efforts, email us at info@probabilitymanagement.org.   

© Copyright 2020 Sam L. Savage