Shaun Doheney, Doug Hubbard, Tom Keelin, and Sam Savage at the Winter Simulation Conference – Dec. 2019

by Sam L. Savage

Shaun & Karen Doheney

Shaun & Karen Doheney

WSC 2019 was more than I had hoped for! I co-chaired a track on Risk Analysis with David Poza (pictured below), ProbabilityManagement.org was involved in a number of presentations, and we had a booth in the exhibitor’s area. Shaun Doheney, our Chair of Resources and Readiness Applications, and I gave several workshops on probability management, and he and his wife Karen generously assisted with logistics. I also want to thank Melissa Kirmse for helping get the papers submitted, and Mary Claire Meijer for managing the track details for me and David.

Doug Hubbard gave a paper on his latest Multi-Seed Pseudo Random Number Generator that can ensure enterprise-wide coherence among networked simulations.

And Tom Keelin presented our joint work with Lonnie Chrisman on solving the long-standing problem of calculating sums of IID Lognormal variables. You won’t want to miss Tom’s presentation on the role of Metalogs in Bayesian Inference at our own Annual Conference in San Jose on April 21 - 22 .

But for me and Tom, the highlight of the conference was meeting Larry Leemis, a prominent professor of Mathematics and Operations Research at William & Mary. A few months ago I had been shown Larry’s interactive chart (below) that displays the mathematical relationships between probability distributions. Shortly before the conference I realized that Larry might be attending WSC and suggested a meeting with Tom. Not only was Larry at the conference, but he had brought several OR graduate students with him. The resulting interactions were stimulating and of particular benefit as we explore the ultimate role of Metalogs in the world of theoretical probability distributions.

 
Sam Savage and David Poza

Sam Savage and David Poza

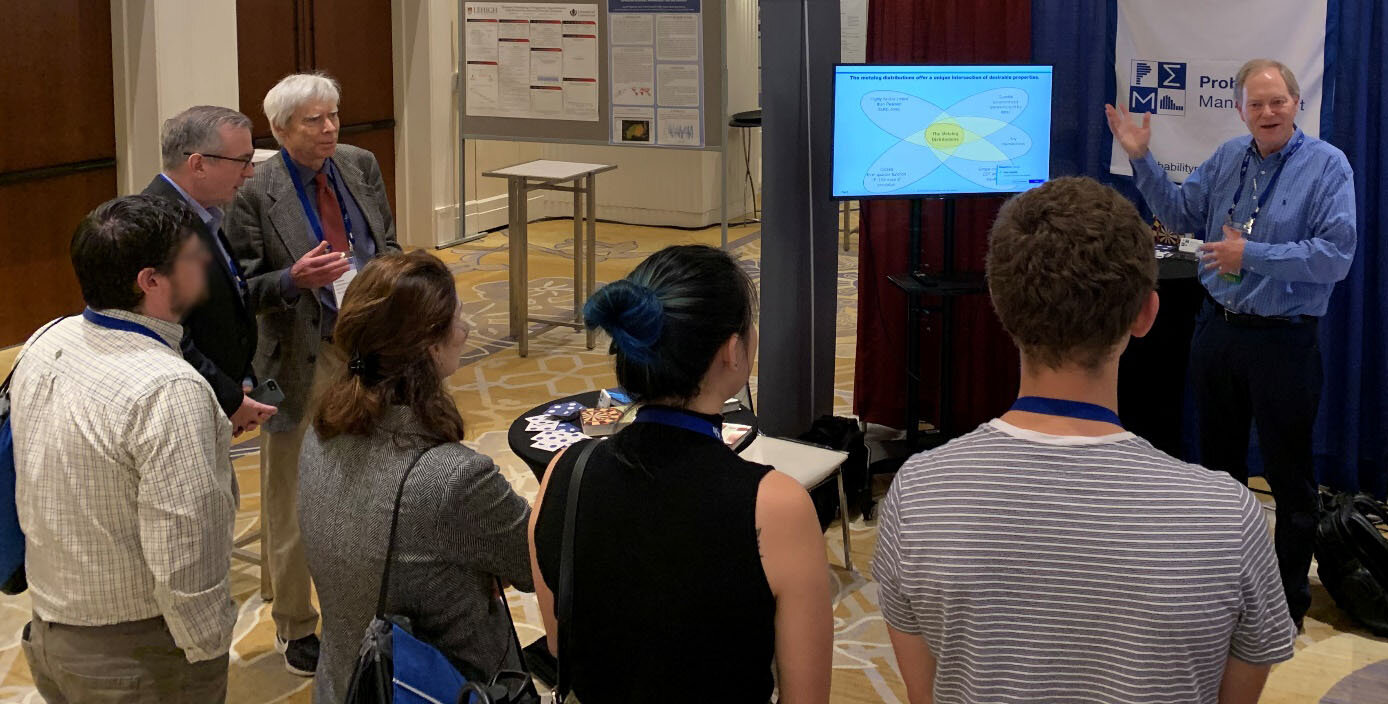
Doug Hubbard, Sam Savage, and a group of Professor Larry Leemis’s graduate students from William & Mary at a presentation on Metalog Distributions by Tom Keelin.

Doug Hubbard, Sam Savage, and a group of Professor Larry Leemis’s graduate students from William & Mary at a presentation on Metalog Distributions by Tom Keelin.

Professor Leemis’s chart of Univariate Distribution Relationships

Professor Leemis’s chart of Univariate Distribution Relationships


© 2019 Sam Savage

Probability Management Raises the Flags at WSC

by Sam L. Savage

WinterSimFlags.png

Winter Simulation Conference
December 8-11

Gaylord National Resort & Conference Center
National Harbor, Maryland

When I recently told a friend that I was going to the Winter Simulation Conference outside of Washington DC next month, she said that in December in that part of the country there was no need to simulate winter because they generally had the real thing. This conference, founded in 1967, is not about simulating winter (although that may be necessary at some point in the future), but takes place in winter.

It is the world’s foremost conference on computer simulation, and I was honored this year to be invited by Peter Haas of the University of Massachusetts to co-chair a track on Risk Analysis with David Poza of the University of Valladolid in Spain.

This conference is perfectly timed to highlight Doug Hubbard’s latest HDR Random Number Generator and Tom Keelin’s Metalog Distribution. Each of these is a technical breakthrough in its own right, but they dovetail beautifully with each other and with the SIPmath Standard to create a whole that is greater than the sum of the parts. ProbabilityManagement.org is proud to fly their flags along with our own at our exhibitors’ booth at the conference.

WSC2019_Logo_web.jpg

Furthermore, Doug, Tom, and I are presenting at the conference itself (abstracts available here):

  • A Multi-Dimensional, Counter-Based Pseudo Random Number Generator as a Standard for Monte Carlo Simulations - Douglas W. Hubbard (Hubbard Decision Research)

  • The Metalog Distributions and Extremely Accurate Sums of Lognormals in Closed Form - Thomas W. Keelin (Keelin Reeds Partners), Lonnie Chrisman (Lumina Decision Systems), and Sam L. Savage (ProbabilityManagement.org)

In addition, Shaun Doheney and I will be giving a tutorial on Virtual SIPs for Networking Simulations, which shows how the work of Hubbard and Keelin is being combined to lay the foundation of the SIPmath 3.0 Virtual SIP standard. We are also giving a Vendor Workshop on Sunday the 8th.

If you are planning to attend and want to schedule a brief meeting with Shaun, Doug, Tom, or me at our booth during the conference, please email Melissa@ProbabilityManagement.org and we will do our best to find a time.

I want to give special thanks to both Mary Claire Meijer and Melissa Kirmse of our team for all their hard work on managing the Risk Analysis track and submitting papers. 

I hope to see some of you there.

© 2019 Sam Savage

The Flaw of Averages in Climate Change

The Average Temperature May Not be on the Rise

by Sam L. Savage

FOA_Climate_Change.png

The average future temperature may not be going up after all. There are big uncertainties in future carbon dioxide and methane levels, as well as the rate at which glaciers will melt, and a host of other things that will certainly drive up the temperature of the earth. But don’t despair. There is also a lot of uncertainty surrounding the occurrence of global nuclear wars, killer asteroid strikes, or eruptions of super volcanoes. And one of these alone could turn the planet into an uninhabitable ball of ice.

For argument’s sake, suppose that if we take these cooling disasters into account, the average future temperature is the same as today. Using Flaw-of-Averages logic, one would argue that we will therefore be as comfortable in the future as we are today. This ridiculous example is meant to convince you that we should not be approaching uncertain environmental issues based on average assumptions, but should use a probabilistic approach. In fact, due to the nonlinearity of environmental effects, the Flaw of Averages impacts nearly every level of analysis.

SIPmath Flood 3.gif

For example, consider an uncertain flood crest that averages 2.4 meters, as shown in the figure below. Because the dikes are 2.5 meters high, the impact of the average flood is zero, but in this example, the average impact is $5.49 million. I urge you to download the interactive model here.

To learn more, see my article in Public Sector Digest on Curing the Flaw of Averages in Climate Change.

Also, on October 3rd, I will be joining Valerie Jenkinson and Jerry R. Schubel in a live webinar on Building Asset Management Strategies in the Age of Climate Change for Coastal Communities.

© 2019 Sam Savage

The Value of Information

VoI meets IoT

by Sam Savage

Severn Darden, one of the founding members of Chicago’s Second City comedy troupe, had a routine in which he played a Professor of Metaphysics.

 “Now, why, you will ask me, have I chosen to speak on the Universe rather than some other topic?’” he would begin in a thick accent. “Well, it's very simple. There isn't anything else!”

In the Information Economy, the same could be said for the Value of Information (VoI).  

It started over half a century ago with a seminal 1966 article entitled Information Value Theory by Professor Ronald A. Howard of Stanford. When I sat in on Howard’s class as an Adjunct Faculty member in the mid-1990s, I was amazed that with all my years of technical education I had never been exposed to this fundamental idea. And I continue to be surprised at how few people are aware of this concept today. I believe that the Internet of Things (IoT) is about to change all that.

My epiphany came during a recent presentation by W. Allen Marr, Founder and CEO of Geocomp, a Boston area geotechnical engineering firm that determines how the earth will respond when you build a bridge or skyscraper on it or drill a tunnel through it. Marr started by pulling out his smart phone, which displayed a live map of Chesapeake Bay, with colored dots representing the recent movements of sensors embedded in a tunnel currently under construction. Then he went on to discuss the use of sensors in an earthen dam, discussed below, which for me sealed the deal on the connection between the Value of Information and the Internet of Things.

First, here is my own informal definition of VoI. In any situation in which you can imagine saying I wish I had found out such and such before I had to decide between this or that, ask what you would have been willing to pay to go from decide then find out to find out then decide.

For example, you can decide to buy a stock or not today, and then find out tomorrow if it goes up or down. How could you find out what a stock was worth in the future and then decide whether to buy it? Easy. Stock options let you do just that, so option pricing is a special case of VoI. 

Ferrari.png

Here’s another example. Suppose you like to drive your Ferrari fast over a stretch of road where you know there is a 20% chance of a radar trap with an associated $500 speeding ticket. You must decide how fast to drive, then find out if you will get a ticket. Your expected loss is 20% x $500 = $100. What is the value of information provided by a radar detector with a 90% accuracy? You get to find out if the detector goes off, then decide to slow down. Now there is only a 2% (10% x 20%) chance of getting a ticket, so your expected loss is 2% x $500 = $10. The VoI is the difference or $90.  

Note that if you are driving a clapped out 60’s vintage VW Bus on the same road, you have nothing to decide about speed. You need to keep the pedal to the metal just to keep up with traffic. Without a decision that could be changed by the information, VoI is zero. 

But let’s get back to Marr’s dam story. 

Suppose the acceptable rate of failure for an earthen dam is once in 10,000 years. And the dam in question looks pretty good until someone points out that it is upstream of a nuclear facility. Uh oh. Now the rules say you need to reinforce it to a rate of one failure in 1 million years. So get out your checkbook, because to patch it up to that strength will cost $800 million.

Dam.jpg

But here is an IoT idea. Consider a sensor network embedded in the dam that has a 99% chance of detecting a failure before it happens. And suppose that the $800 million patch job could be done quickly and would still have a 99% chance of saving the dam after the sensor network goes off. We have gone from decide to spend $800 million, then find out if we really had to, to find out if the dam will fail then decide to spend the $800 million. 

So, what is the value of the information provided by the sensor network? Of course, one must really look at the net present value over an extended period, the reliability of the sensor network, etc, etc,  but let’s start with the first year. We have an operational sensor network which reduces the likelihood of dam failure to the goal of about 1 in 1,000,000, but since we did not reinforce it, there is still about 1 chance in 10,000 that the sensors will detect that the dam is unhealthy, in which case we will need to spend the $800,000,000. So, our expected cost is roughly $80,000 for a savings (VoI) in the first year of $799,920,000. So does the sensor network cost less than that? Are you kidding? It’s $500,000. And according to Marr, doing the economics for 30 years, including monitoring and maintenance of the network, adds another $2 million. Marr calls this application of real-time monitoring to detect and respond to emerging risks “Active Risk Management.” The actual details are more complex and the statics assume an “average” dam, but you get the idea. Data from sensors can provide great value.

Marr’s presentation made me wonder about the total value of the information coming from each of the other 20 billion things on the internet. And this led to the theme of this year’s Annual Conference: Data, Decisions, and the Value of Information.  

I am happy to announce that Allen himself will be a highlighted speaker, along with other pioneers in information economics and the internet of things.

MeasurementInversion.png

For example, Doug Hubbard, author of the popular “How to Measure Anything” series, has made a career out of VoI. He has discovered that ignorance of this subject leads to an ironic outcome, which he calls Measurement Inversion.  When he ranks the effort that firms put into measuring things next to the information value of those measurements, he finds that they go in “exactly” the wrong direction. That is, the most effort is spent collecting the least valuable information. 

Another long-time supporter of ProbabilityManagement.org who will also be presenting is Steve Roemerman, CEO of Lone Star Analysis, a Dallas-based firm working in logistics, aerospace, and oil & gas. They have been a pioneer in IoT, with lots of practical experience. According to Steve, “In more than one of our IoT engagements, we found the customers already had all (as in 100%) of the information they needed.” The real problem was to integrate the information for making better predictions and decisions. Steve also warns that “brute force sensor deployment for its own sake is one reason we see IoT deployments fail.” This only reinforces the need to understand the concept of VOI both with the information you have already, and the information you are planning to acquire.

© Copyright 2019 Sam L Savage

An Excel Data Table Killer App

by Sam Savage, Executive Director, and and Dave Empey, Director of Software Development, ProbabilityManagement.org

KillerApp.png

No, no, no! We don’t mean a killer app using the Excel Data Table, like SIPmath simulation. We mean an app that will kill your data table, for example, your SIPmath simulation.

It all started last week when the Dice Calculator (Excel file), which is supposed to instantaneously roll a pair of dice 10,000 times, suddenly started taking ten seconds on one of our machines. Flash back to the late 1980’s when Bill Sharpe, Nobel Laureate in Economics, discovered that the data table in Lotus 1-2-3 could perform simple Monte Carlo simulations. We tried this in Excel in the early 1990s, and although it showed great promise, it often caused the spreadsheet program to crash unceremoniously. When we discovered in 2012 that the Excel Data Table could instantaneously perform tens of thousands of calculations of the Rand() formula, we were ecstatic. Furthermore, using the Index formula, Excel could read SIPs as well. With interactive Monte Carlo simulation available on every desktop, we were able to get corporate sponsorship for ProbabilityManagement.org, and we incorporated as a 501(c)(3) nonprofit in 2013.

But where were we? Oh yes. There are only two things that really keep us at up at night.

The first is that Jensen’s Inequality (the strong form of the Flaw of Averages) will be declared to be Fake Math. We have been working together for decades, offering a money back guarantee to our consulting clients on the validity of this well-established mathematical result. If the internet deems it false, our careers are over.

The second nightmare is that the Excel Data Table, which has done for simulation what penicillin did for bacterial disease, ceases to work. This would spell the end of SIPmath for Excel.

So, when something that was supposed to be instantaneous took ten seconds, we freaked out. We re-installed Excel twice on the offending machine, but nothing worked. Then we realized that the installation process was so seamless that it left all the Excel add-ins in place. By process of elimination we found that one of our own experimental add-ins was slowing down any instance of the Data Table by orders of magnitude.

Volatile Functions 

Here’s the scoop. Some formulas in Excel are known as Volatile, because they recalculate with each keystroke. Most formulas do not have this feature. For example, if cell A1 contains =B1+C1, then A1 will not re-calculate unless either B1 or C1 change. RAND(), on the other hand is Volatile. Since it doesn’t depend on anything it needs to change with every keystroke.

Warning: Do not use a SIPmath model in Excel while another workbook is open that contains RAND() or it will run very slowly.

We have known that for a long time. But what does that have to do with an add-in? Well, our add-in had Excel worksheets built into it for use as templates. They didn’t use RAND(), but they did use other Volatile functions, such as OFFSET. Worse they used OFFSETs that drove hundreds of other cells. It was like having hundreds of Volatile cells in Excel all the time, whenever the add-in was loaded.

Updated Warning: Do not use Volatile functions in the vicinity of SIPmath models. That is, close all worksheets with Volatile functions before using a SIPmath model. You can use RAND() in a SIPmath model, but not the model next door. And there are some other exceptions that seem to work. But please be careful or your models will grind to a halt just as you are making that great analytical pitch.

To better understand this phenomenon, we created a killer app in Excel that destroys the performance of the Data Table in any worksheet.  At first, we planned to publish it as a download with this blog. But on second thought that would be like publishing plans for a weapon of mass destruction, so we are keeping it in hermetically sealed container in the lab.

To learn more about Volatile functions, see http://www.decisionmodels.com/calcsecretsi.htm.

© Copyright 2019 ProbabilityManagement.org

The Military Operations Research Symposium

An F4 Phantom with the Air Force Academy Chapel in the background

An F4 Phantom with the Air Force Academy Chapel in the background

And the Naval Postgraduate School OR Network

by Sam Savage

US Air Force Academy June 17-20

I just returned from the 87th Symposium of the Military Operations Research Society at the Air Force Academy in Colorado Springs. ProbabilityManagement.org had a proud showing. Shaun Doheney, PM Chair of Resources and Readiness Applications, Connor McLemore, PM Chair of National Security Applications, and I gave a total of four presentations. Despite being on the last day of the conference, Shaun and Connor delivered two sessions on Readiness Modeling: Changing the Question from “Ready or Not?” to “Ready for What?”, which drew standing room attendance. See Shaun and Connor’s recent blog and access their slides and models on PM’s Readiness page.

Connor McLemore

Connor McLemore

The field of Operations Research (OR) grew out of the application of mathematical analysis to the tremendous resource allocation problems of World War II. After the war, OR took on additional names, such as Management Science, Analytics, and others, but it all boils down to analyzing your options and figuring out mathematically how to do the most with the least. The primary professional societies are INFORMS (the Institute For Operations Research and the Management Sciences) and MORS (the Military Operations Research Society).

My father, L. J. Savage, was in the thick of war time OR at Columbia’s Statistical Research Group. In the early 1940’s he worked with future Nobel Laureates Milton Friedman and George Stigler. They tackled such problems as determining whether a fighter should carry six 50- or eight 30-caliber machine guns, and the best strategy for hunting enemy submarines. My own PhD research was on the Travelling Salesman Problem, a classic OR problem.

NPSMonterey.png

But back to the symposium. The meeting made me realize just how heavily Military Operations Research has been influenced by the incomparable OR Department of the Naval Postgraduate School (NPS) in Monterey, California. The school provides active duty military and other government employees as well a few international students with rigorous graduate education, mostly master’s degrees and some PhDs. Areas include Engineering, International Studies, Computer Science, Business, and OR. I first visited the NPS OR department in the early 1990’s when my dear friend and former department chair, the late Rick Rosenthal, invited me down from the Stanford OR Department to give a talk. I found it unlike the typical academic programs in OR, which are often quite theoretical and PhD-dominated. First, NPS students start out with military discipline so they all pay attention. Second, they are learning through the solution of real military problems, for which doing the most with the least may have life or death repercussions. Here is a place where there is every reason to stay and work because the results matter. And with its spectacular setting on the shore of Monterey Bay, there is no reason to go anywhere else. It was love at first visit.

NPS OR has played an outsized role at ProbabilityManagement.org. Shaun and Connor are both grads, and Connor also taught there, introducing SIPmath. Phil Fahringer, a Lockheed Martin Fellow and the nonprofit’s primary contact at that organization, has an OR degree from NPS as well. In Colorado Springs I reconnected with many others from NPS whom I have known over the years and realized what a powerful intellectual network they represent. I also had the pleasure of an extended conversation with Doug Samuelson, a prominent OR Analyst whom I had only known peripherally. I proposed that the OR department at NPS was the Harvard Business School of Operations Research. Doug disagreed and said I was being charitable to Harvard.

© 2019 Sam L. Savage

Ready For What?

by
Shaun Doheney, Chair of Resources and Readiness Applications
Connor McLemore, Chair of National Security Applications

WantNail.png

For want of a nail the shoe was lost.
For want of a shoe the horse was lost.
For want of a horse the rider was lost.
For want of a rider the message was lost.
For want of a message the battle was lost.
For want of a battle the kingdom was lost.
And all for the want of a horseshoe nail.

The proverb “For Want of a Nail” describes how seemingly inconsequential details can lead to a disaster in military readiness, and is a valuable lesson for us all.  For those of us who make decisions or support decision-making involving risks or uncertainty, we need to have an answer to the question, “are we ready?”  Of course, that question should almost always be followed by the question, “ready for what?”  Are we ready to respond to the next natural disaster?  Are we ready to mitigate market volatility?  Is our energy infrastructure ready to handle the increased demand this summer?  Is our city ready for the expected increased growth over the next five years?

We (Connor McLemore and Shaun Doheney) have had military Operations Research experience, and have been working with Dr. Sam Savage here at ProbabilityManagement.org on an improved representation of military readiness. This provides a framework that we believe is useful, logically consistent, and most importantly is simple enough for adoption by military decision makers and those support such decision-making. As a poster child of poor military planning see the PowerPoint and Excel model describing the failed mission to rescue the American hostages in Iran in 1980.

OperationEagleClaw.png
 

One of the key components to this readiness representation framework is the ability to roll up readiness in a logical, mathematically sound, and intuitive way.  To paraphrase Dr. Savage in his recent blog titled, Why Was RiskRollup.com Available?, if squadron A has a 60% chance of accomplishing the mission and squadron B has a 70% chance, then if we send them both is there a 130% chance of success?

Recent improvements in our ability to account for uncertainty allow us to rethink approaches to representing military readiness.  To demonstrate our approach, we’ve created a few prototype models that you may download here

RolledUpReadiness.png
 

We hope that you’ll join us during the upcoming Military Operations Research Society (MORS) Symposium when we give presentations and a tutorial on this work.  While improved readiness accounting across the military and business or enterprises will likely be an evolutionary process with inputs from numerous stakeholders, the key in almost all situations is to “start small and reinforce success,” as Shaun likes to say.  And as Connor likes to say, “Go Navy; beat Army!”  But that’s a blog for another time!

© 2019 ProbabilityManagement.org

Datasaurus Arithmetic

Thank you, Alberto Cairo and Robert Grant

by Sam Savage

Datasaurus Arithmetic

Datasaurus Arithmetic

 
Data set HAP and PY

Data set HAP and PY

The three great milestones of manned flight were the Wright Brothers in 1903, the lunar landing in 1969, and the lithium ion laptop battery of the 1990s. This last breakthrough allowed me (while buckled into an airline seat to control my ADD) to develop a data set to dent the steam-era concept of correlation. I was on a flight from the East Coast to San Francisco, and over Denver I reached my goal: two variables, called HAP and PY, which had zero correlation, but nonetheless displayed a clear interdependency, as shown.

As I mentioned in my earlier blog on Virtual SIPs, I am not the only one poking fun at statistical concepts with ridiculous scatter plots. Alberto Cairo, a professor of Visual Journalism at the University of Miami, has a downloadable data set called Datasaurus, which has several X,Y pairs of data points, with identical summary statistics and correlation, but wildly different scatter plots. Alberto created his masterpieces with an interactive tool called DrawMyData from data scientist Robert Grant.

Never one to leave the bizarre well enough alone, I could not resist creating a model called Datasaurus Arithmetic, in which you may perform SIPmath calculations on the various patterns in Alberto’s dataset. Above we see the marginal distribution of X and Y (which I call Dino and saur), along with calculations involving the sum, product and quotient of X and Y while preserving the Jurassic joint distribution of X and Y.

If you teach statistics or data science, I urge you to download the file and compare the scatter plots and summary statistics of Alberto’s other included data sets.

Ⓒ 2019 Sam Savage

Hubbard/KPMG Enterprise Risk Management Survey

by Sam L. Savage

Hubbard Decision Research and KPMG have launched a short Risk Management survey, which I urge you to take and to forward to others before March 10. It only takes 6 – 7 minutes to fill out and will help us better understand this important but poorly defined field.

Doug will be presenting on The Failure of Risk Management at our Annual Conference in San Jose in March, and I am eager to get his first impression of the responses. And don’t forget that Tom Keelin, inventor of the Metalog distributions, will also be there. The next generation SIPmath Standard, which leverages Doug’s HDR Distributed Random Number Framework and Tom’s Metalogs, will facilitate a more quantitative approach to Enterprise Risk Management.

© Sam Savage 2019

Why Was RiskRollup.com Available?

RiskRollUp.png

by Dr. Sam Savage

Risk Doesn’t Add Up

If the risk of a power outage in City A next year is 60% and the risk of an outage in City B is 70%, then the risk of an outage across both cities is 130%, right? Obviously not, but what is it? Before the discipline of probability management, you couldn’t just add up risks. But today, you can represent the uncertainty of an outage in each city as a SIP as shown, where a 1 indicates an outage in that city. Simply summing the SIPs row by row provides the number of failures across both cities, then using the “Chance of Whatever” button in the SIPmath Tools you will find that that the risk of at least one failure across both cities is 88%. This pastes the following formula into the spreadsheet.

=COUNTIF( Sum, ">=1") / PM_Trials, where PM_Trials is the number of trials.

I am currently working with Shaun Doheney and Connor McLemore to apply these idea to Military Readiness, and Shaun will be presenting the MAP Model at our upcoming Annual Conference.

Nobody Has a Clue That This is Possible

How do I know? I recently bought RiskRollup.com, ConsolidatedRiskManagement.com, and ConsolidatedRiskStatement.com for $11.99 each. I probably won’t be able to retire on these investments, but I’ll bet I get a decent return.

Probability Management is Stochastic Optimization Without the Optimization

The holy grail of consolidated risk management is to optimize a portfolio of mitigations to provide the best risk reduction per buck. You might think that if people aren’t even rolling up risk today, we must be years away from optimizing. But that is not true. The concept of SIPs and SLURPs was in use in the field of stochastic optimization (optimizing under uncertainty) long before probability management was a gleam in my eye. This is the technique we applied at Royal Dutch Shell in the application that put probability management on the map. The scenarios of uncertainty generated by stochastic optimization are effectively SLURPs, and I argue that they are too valuable in other contexts not to be shared in a corporate database.

We are honored that a pioneer in stochastic optimization, Professor Stan Uryasev of the University of Florida, will also be presenting at our Annual Conference.  I know I have a lot to learn from him. I hope you will join us in March.

More on rolling up risk and a discussion of the Consolidated Risk Statement are contained in a December 2016 article in OR/MS Today.

Ⓒ 2019 Sam Savage