Simulating Rags to Riches and Vice Versa
by Sam Savage
Planning vs. Scheming
Since much of my income is from consulting, I have devoted resources to reaching out to appropriate clients. I can’t count the number of engagements I’ve gotten this way because there aren’t any. All my engagements have dropped in from out of the blue.
“But how about your 2009 book?” you say. “That was marketing on a grand scale. Some would have even called it selling out. You must have had customers breaking down your door after that.”
Nope. There was a horrific worldwide recession and I lost my key clients instead of getting new ones.
“But things are going great now, right?” Absolutely, and I am deeply thankful. But this was due to dumb luck, such as the improved Data Table function in Microsoft Excel, which enabled SIPmath, and stumbling upon adult supervision in the nick of time.
None of my successes have been planned and none of my plans have been successful. So, I don’t plan (much to the consternation of my adult supervisors). Instead, I scheme, by putting options in place in case the appropriate planets align. However, Louis Pasteur said that “Chance favors the prepared mind,” and I do try to prepare my mind. I just don’t plan.
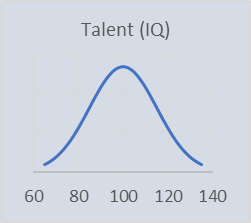
So, when I heard that three Italian physicists (Pluchino, Biondo, & Rapisarda) had written a paper called “Talent vs Luck: the role of randomness in success and failure,” I was all ears. Among other things, they address the question of why, if talent is distributed along a bell curve, that wealth is extremely skewed with the top few percent of the population owning the lion’s share. They created a simulation that shows how chance drives the disparity in the distributions of talent and wealth. Inspired by the physicists, Dave Empey [1] and I built our own SIPmath model in Excel (available on our Models page) to explore similar principles. Our model shows that chance plays a role, but that disparity in income can arise without it. NOTE that unlike the physicists’ model, ours is not calibrated to reality, and is merely designed to give directional results.
The Model
Free models, like free advice, are worth what you pay for them. The admonition of George Box, that “all models are wrong, but some are useful,” applies in spades to economics, where Chaos Theory is always lurking a few decimal places away. I think the Italians would agree with me that such models do not provide “right answers” as much as “right questions.”
With the above caveats in mind, our model has the following elements.
1. We start with 50 agents, whose talents are measured in IQ score, normally distributed with mean of 100 and standard deviation of 15. These are assigned at the beginning and do not change during the simulation.
We also endow the agents with an initial wealth distribution, which may be uniform, or skewed either toward the high or low intelligence agents.
2. . We then simulate two forms of IQ-based income (wealth accumulation) over twenty years; either adding wealth proportional to IQ or multiplying wealth by a factor proportional to IQ. In either case the user may specify a degree of uncertainty from year to year.
3. We also allow for additional Chance Events that can impose independent positive or negative impacts for each agent.
4. A heatmap displays the relative wealth by year each agent for a single trial. It is fun to crank up the uncertainty, press the <calculate> key, and watch the unsuspecting agents succeed or fail beyond their wildest simulated dreams.
5. Given the above calculations, we run 100 simulated trials of final wealth for each of the 50 agents, effectively generating a simulated population of 5,000 agents over which we calculate the final wealth distribution.
Results
A key result of Pluchino, Biondo, & Rapisarda is that the final wealth in their simulation (which was more complex than ours) was very skewed even though talent was normally distributed. Our model indicates that you can’t sneeze without creating a skewed distribution of final wealth. For example, suppose there is no uncertainty, and all agents start with equal wealth, that increases each by a percentage proportional to their IQ. This is analogous to agents with investments that grow at different rates. Then you get the distribution of final wealth shown below.
Here we have the top 1% of the population holding 10% of the wealth. Adding additional uncertainties makes the skew worse, but talk is cheap, I suggest that you download the model here and play with it yourself.
[1] Director of Software Development at ProbabilityManagement.org and programmer of the SIPmath™ Modeler Tools.


