
By Dr. Sam L. Savage. Illustration by John Button.

In the mid-1990s when Ben Ball and I began applying Markowitz Portfolio Theory to petroleum exploration (see Chapter 28 in The Flaw of Averages: Why We Underestimate Risk in the Face of Uncertainty) we would often be asked what type of software a firm should buy for that purpose. I would respond by saying that’s like someone who wants to build a house asking what kind of hammer to buy instead of looking for an architect.
I have seen this story play out many times. In the arithmetic of uncertainty, simulation software plays the role of pencils. Recently a large organization that had failed to adopt the arithmetic of uncertainty despite spending seven figures on many copies of a well-known simulation package, reached out to the nonprofit to get a quote on our own “pencils.” Yet, they rejected a bid for an inexpensive course on the arithmetic of uncertainty.
ProbabilityManagement.org’s mission has always been to develop and promote the Hindu/Arabic numerals of uncertainty, and the open SIPmath™ 3.0 Standard fulfills this mission. Now we must instruct decision makers in the laws of the arithmetic of uncertainty, so they at least know that they can’t get there by just buying software. I have outlined the most important concepts in the arithmetic of uncertainty below.
A Primer in the Arithmetic of Uncertainty
Beyond the four concepts of addition, subtraction, multiplication, and division, five additional concepts are required for the arithmetic of uncertainty. These are briefly outlined below and detailed in The Flaw of Averages. For each concept I have listed a related academic term in red Dracula font, which should be stricken from your vocabulary if you do not want to induce Post Traumatic Statistics Disorder (PTSD) in the people with whom you are attempting to communicate.
1. Uncertainty vs. Risk
Is there a risk that IBM stock will go down next week? Heck no. I have shorted IBM stock. The risk for me is that IBM goes up. Risk is in the eye of the beholder. The way in which we individually behold different uncertainties is known as our Risk Appetite, Risk Attitude or Risk Preference. The area of Economics addressing this topic is:

2. Uncertain Numbers
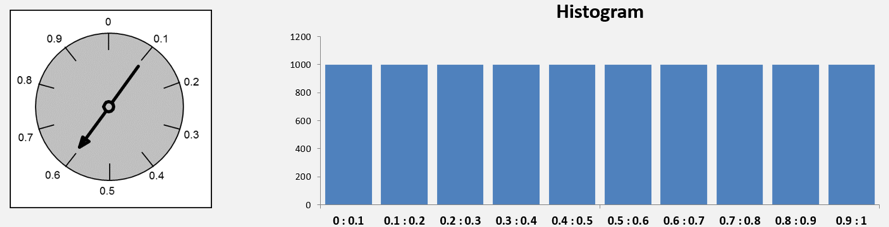
Uncertain numbers are best viewed as shapes, often known as Histograms, which indicate the relative likelihood of the values of the uncertainty. For example, a gameboard spinner has a flat histogram because all numbers are equally likely.
The word that mathematicians use to scare people about this concept is:

3. Combinations of Uncertainties
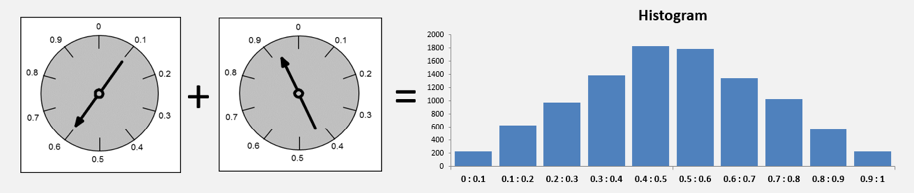
When independent uncertain numbers are added together the shape goes up in the middle. The sum of two spinners has a triangular histogram for example. Why? There are more combinations in the middle, the way there are more combinations of rolling dice that end up with seven rather than two or twelves.
This is at the heart of the most important concept in Risk Management, Diversification. It also leads to the famous Bell-Shaped Curve. The PTSD inducing word is:

4. Plans Based on Uncertain Assumptions
Consider a drunk, wandering back and forth on a busy highway whose average position is the center line.

I call this the Strong Form of the Flaw of Averages, but mathematicians call it:

5. Interrelated Uncertainties
The best way to grasp the interrelationship between uncertainties is through a scatter plot. Mathematicians often use the terms Correlation or Covariance. These not only trigger PTSD, but completely fail in the case of the Happy Face because they are both Zero for this set of data.

Copyright © 2023 Sam L. Savage